


Trusted by over 15 Million Traders
The Most Awarded Broker
for a Reason
Easy Access to 1,400+ Global Assets
EURUSD
Euro vs U.S. Dollar
US500
S&P 500 (US500)
GOLD
Gold
COFFEE
US Coffee
Apple
Apple (AAPL.OQ)
-

Finance Magnates 颁发
-

Finance Magnates 颁发
-

Capital Finance International Magazine (CFI.co) 2024年颁赠
-

COLWMA 2024年颁赠
-

荣获World Finance Forex Awards 2023最佳外汇客户服务奖
-

荣获World Finance Forex Awards 2023欧洲最佳外汇经纪商奖
-

荣获World Finance Forex Awards 2023澳大拉西亚最佳外汇经纪商奖
-

荣获World Finance Forex Awards 2023拉丁美洲最佳外汇经纪商奖
-

荣获World Finance Forex Awards 2023中东最佳外汇经纪商奖
-

CFI.co于2023年颁赠
-

荣获2023年City of London Wealth Management Awards
-

荣获2022年埃及金融博览会颁赠
-

荣获2022年City of London Wealth Management Awards
-

CFI.co于2022年颁赠
-

荣获Global Forex Awards 2022 — 零售外汇 颁赠
-
2021年迪拜外汇博览会获颁赠
-

Ultimate Fintech 2021年颁赠
-

荣获2021年City of London Wealth Management Awards
-

FX168于2020年12月颁赠
-

荣获Global Business Awards 2020
-

荣获2020年City of London Wealth Management Awards
-

Capital Finance International Magazine (CFI.co)颁赠
-

Capital Finance International Magazine (CFI.co)颁赠
-

荣获2019年City of London Wealth Management Awards
-

Shares Magazine 授予 UK Forex Awards 2018
-

Capital Finance International Magazine (CFI.co)颁赠
-

Capital Finance International Magazine (CFI.co)颁赠
-

2017年伦敦财富管理奖
-

2016最佳本土 客户服务
-

中东和北非地区(MENA)增长最快的经纪商
-
2015年最佳外汇科技提供商
-
2014年最佳外汇科技提供商
-

2014年最佳外汇科技提供商
-

荣获 The Trading Show 2024年非洲 Africa Fintech 峰会颁赠
-

荣获2024年中东地区 Brokersview 颁赠
-
荣获2024年中东地区 Brokersview 颁赠
-

荣获2024年阿曼 Smart Vision 峰会颁赠
-

荣获2024年迪拜外汇博览会颁赠
-

荣获2024年迪拜 Forex Traders Summit 颁赠
-

2024年埃及 Smart Vision 峰会颁赠
-

投查查于2024年颁赠
-

Capital Finance International Magazine (CFI.co) 2024年颁赠
-

CFI.co于2023年颁赠
-

CFI.co于2023年颁赠
-

交易社区平台FOLLOWME于2022年颁赠
-
2022年迪拜Forex Expo获颁赠
-
2022年迪拜Forex Expo获颁赠
-

荣获Global Forex Awards 2022 — 零售外汇 颁赠
-

CFI.co于2022年颁赠
-

CFI.co于2022年颁赠
-

World Finance Forex Awards 2022 颁发
-

World Finance Forex Awards 2022 颁发
-

World Finance Forex Awards 2022 颁发
-

World Finance Forex Awards 2022 颁发
-
交易社区平台FOLLOWME于2021年颁赠
-

2021年埃及Smart Vision Investment Expo博览会获颁赠
-

CFI.co于2021年颁赠
-

CFI.co于2021年颁赠
-

荣获Global Forex Awards 2021 — 零售外汇 颁赠
-

荣获Global Forex Awards 2021 — 零售外汇 颁赠
-

World Finance 2021颁发
-

World Finance 2021颁发
-
FOLLOWME于2021年颁赠
-

Global Forex Awards 2021 — B2B 颁赠
-

Global Forex Awards颁赠
-

Global Forex Awards颁赠
-

CFI.co于2020年颁赠
-

CFI.co于2020年颁赠
-

荣获Global Business Awards 2020
-

World Finance Magazine 颁赠
World Finance Forex Awards 2020 -

World Finance Magazine 颁赠
World Finance Forex Awards 2020 -
FOLLOWME交易社区授予
-

Global Forex Awards颁赠
-

Global Forex Awards颁赠
-

FinTech Age Awards颁发
-

World Finance Magazine 颁赠
World Finance Forex Awards 2019 -

World Finance Magazine 颁赠
World Finance Forex Awards 2019 -

荣获 World Finance Forex Awards 2018 颁赠
-

荣获2018年埃及金融博览会颁赠
-

荣获 Shares Magazine 的 UK Forex Awards 2017 颁赠
-

荣获 World Finance Forex Awards 2017
-

2016年最佳黄金经纪商
-

2016年最佳外汇经纪商
-

2015年最佳本地客户服务
-

Global Brands Magazine 颁赠
-

Online Money Awards 2022 颁发
-

荣获2022年埃及金融博览会颁赠
-

2015最佳外汇交易平台
-

2015最佳金融交易平台
-

2013最佳创新外汇平台奖
-

2020年 Cyprus HR Awards 颁赠
-

金融行业的佼佼者
-

认证最优金牌级别
-

2014年首届亚军
-
Finance Magnates 颁发
-
Finance Magnates 颁发
-
Capital Finance International Magazine (CFI.co) 2024年颁赠
-
COLWMA 2024年颁赠
-
荣获World Finance Forex Awards 2023最佳外汇客户服务奖
-
荣获World Finance Forex Awards 2023欧洲最佳外汇经纪商奖
-
荣获World Finance Forex Awards 2023澳大拉西亚最佳外汇经纪商奖
-
荣获World Finance Forex Awards 2023拉丁美洲最佳外汇经纪商奖
-
荣获World Finance Forex Awards 2023中东最佳外汇经纪商奖
-
CFI.co于2023年颁赠
-
荣获2023年City of London Wealth Management Awards
-
荣获2022年埃及金融博览会颁赠
-
荣获2022年City of London Wealth Management Awards
-
CFI.co于2022年颁赠
-
荣获Global Forex Awards 2022 — 零售外汇 颁赠
-
2021年迪拜外汇博览会获颁赠
-
Ultimate Fintech 2021年颁赠
-
荣获2021年City of London Wealth Management Awards
-
FX168于2020年12月颁赠
-
荣获Global Business Awards 2020
-
荣获2020年City of London Wealth Management Awards
-
Capital Finance International Magazine (CFI.co)颁赠
-
Capital Finance International Magazine (CFI.co)颁赠
-
荣获2019年City of London Wealth Management Awards
-
Shares Magazine 授予 UK Forex Awards 2018
-
Capital Finance International Magazine (CFI.co)颁赠
-
Capital Finance International Magazine (CFI.co)颁赠
-
2017年伦敦财富管理奖
-
2016最佳本土 客户服务
-
中东和北非地区(MENA)增长最快的经纪商
-
2015年最佳外汇科技提供商
-
2014年最佳外汇科技提供商
-
2014年最佳外汇科技提供商
-
荣获 The Trading Show 2024年非洲 Africa Fintech 峰会颁赠
-
荣获2024年中东地区 Brokersview 颁赠
-
荣获2024年中东地区 Brokersview 颁赠
-
荣获2024年阿曼 Smart Vision 峰会颁赠
-
荣获2024年迪拜外汇博览会颁赠
-
荣获2024年迪拜 Forex Traders Summit 颁赠
-
2024年埃及 Smart Vision 峰会颁赠
-
投查查于2024年颁赠
-
Capital Finance International Magazine (CFI.co) 2024年颁赠
-
CFI.co于2023年颁赠
-
CFI.co于2023年颁赠
-
交易社区平台FOLLOWME于2022年颁赠
-
2022年迪拜Forex Expo获颁赠
-
2022年迪拜Forex Expo获颁赠
-
荣获Global Forex Awards 2022 — 零售外汇 颁赠
-
CFI.co于2022年颁赠
-
CFI.co于2022年颁赠
-
World Finance Forex Awards 2022 颁发
-
World Finance Forex Awards 2022 颁发
-
World Finance Forex Awards 2022 颁发
-
World Finance Forex Awards 2022 颁发
-
交易社区平台FOLLOWME于2021年颁赠
-
2021年埃及Smart Vision Investment Expo博览会获颁赠
-
CFI.co于2021年颁赠
-
CFI.co于2021年颁赠
-
荣获Global Forex Awards 2021 — 零售外汇 颁赠
-
荣获Global Forex Awards 2021 — 零售外汇 颁赠
-
World Finance 2021颁发
-
World Finance 2021颁发
-
FOLLOWME于2021年颁赠
-
Global Forex Awards 2021 — B2B 颁赠
-
Global Forex Awards颁赠
-
Global Forex Awards颁赠
-
CFI.co于2020年颁赠
-
CFI.co于2020年颁赠
-
荣获Global Business Awards 2020
-
World Finance Magazine 颁赠
World Finance Forex Awards 2020 -
World Finance Magazine 颁赠
World Finance Forex Awards 2020 -
FOLLOWME交易社区授予
-
Global Forex Awards颁赠
-
Global Forex Awards颁赠
-
FinTech Age Awards颁发
-
World Finance Magazine 颁赠
World Finance Forex Awards 2019 -
World Finance Magazine 颁赠
World Finance Forex Awards 2019 -
荣获 World Finance Forex Awards 2018 颁赠
-
荣获2018年埃及金融博览会颁赠
-
荣获 Shares Magazine 的 UK Forex Awards 2017 颁赠
-
荣获 World Finance Forex Awards 2017
-
2016年最佳黄金经纪商
-
2016年最佳外汇经纪商
-
2015年最佳本地客户服务
-
Global Brands Magazine 颁赠
-
Online Money Awards 2022 颁发
-
荣获2022年埃及金融博览会颁赠
-
2015最佳外汇交易平台
-
2015最佳金融交易平台
-
2013最佳创新外汇平台奖
-
2020年 Cyprus HR Awards 颁赠
-
金融行业的佼佼者
-
认证最优金牌级别
-
2014年首届亚军

Awarded BestBrokerYear After Year
market news
The weekly line is big negative to break the support, and the gold and silver range is high and the sky
Wonderful introduction:
Since ancient times, there have been joys and sorrows, and since ancient times, there have been sorrowful moon and songs. But we never understood it, and we thought everything was just a distant memory. Because there is no real experience, there is no deep feeling in the heart.
Hello everyone, today XM Foreign Exchange will bring you "[XM Foreign Exchange Platform]: Weekly line has a big negative support, and the gold and silver range is high in the sky." Hope it will be helpful to you! The original content is as follows:
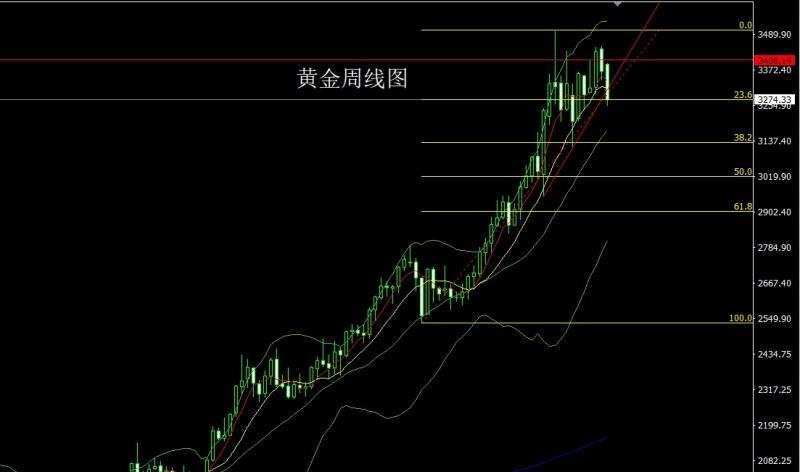
Last week, the gold market opened high at the beginning of the week, and then the market rose slightly. After giving a weekly high of 3391.3, the market fluctuated strongly. By the lowest level of Friday's weekly line, the market finally closed at the 3274.3 position, and then the market closed with a large negative line with a long lower shadow line. After this pattern ended, the early opening high and then fell back to give a 3242 long stop loss of 3237. The target is 3256 and 3265 and 3274 and 3283. If the break is made, 3292 and 3300 leave the market and backhandedly leave.
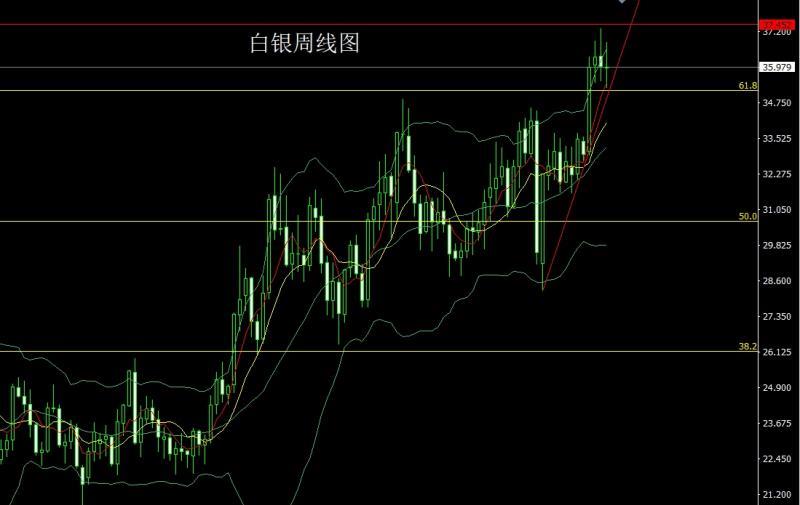
The silver market opened at 35.96 last week and then rose slightly. The market fell sharply. The weekly line was at 35.96, and the market rose strongly. The weekly line reached the lowest position of 35.261, and the market rose strongly. The weekly line finally closed at 35.975, and the market closed with a long-foot cross star with an upper shadow longer than the lower shadow. After this pattern ended, the weekly line was long-stop loss of 35.15 this week, and the target was 35.8, 36 and 36.2 to leave the market and prepare to be short.
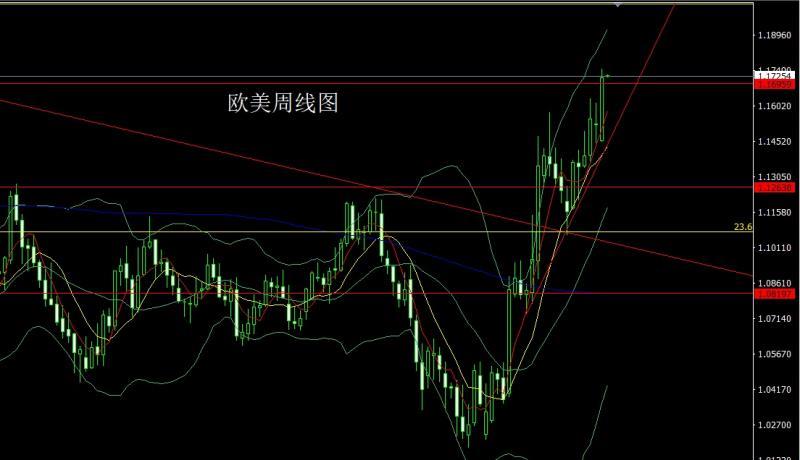
The European and American markets opened lower last week at 1.14544 after the market opened lower last weekAfter a slight retracement, the market rose strongly. The weekly line reached the highest point of 1.17541 and then the market consolidated. The weekly line finally closed at the position of 1.17185 and the market closed with a large positive line with a longer upper shadow line. After this pattern ended, the stop loss of more than 1.16950 this week was 1.16750, and the target was 1.17500 and 1.17750 and 1.18000.
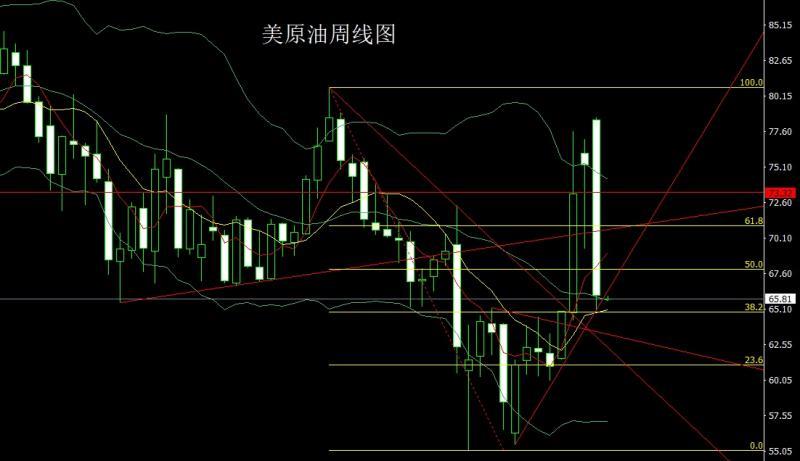
The U.S. crude oil market opened higher at 78.45 last week and then rose slightly, giving a position of 78.59. The market fell strongly. The weekly line was at the lowest point of 65.08 and then the market consolidated. The weekly line finally closed at 66.03 and then closed with a large negative line with a long lower shadow line. After this pattern ended, the lower target of 66.8 short stop loss of 67.1 this week is 66.2 and 66 and 65.5 and 65. If it falls below, look at 64 and 63.
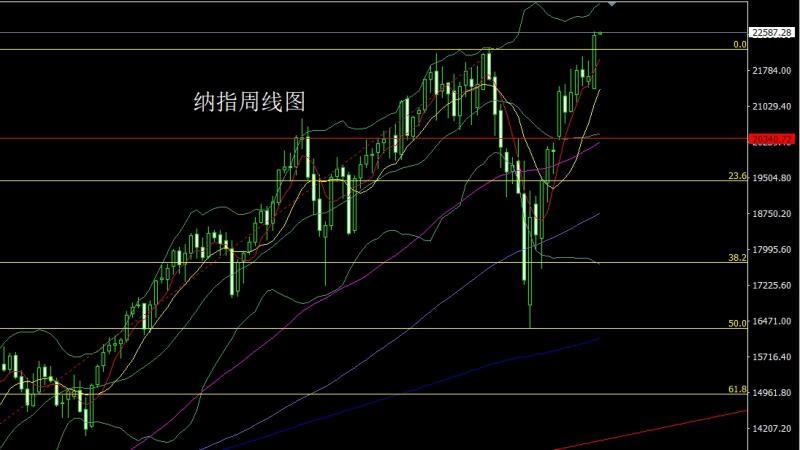
Nasdaq index market opened lower last week at 21398.21, and the market slightly fell back. After giving the position of 21385.91, the market strongly rose. The weekly line reached the highest point of 22603.91. After the market consolidated, the weekly line finally closed at 22514.76. The axis closed with a large positive line with a slightly longer upper shadow line. After this pattern ended, the stop loss of more than 22450 this week was 22380, with the target of 22600 and 22700 and 22800.
Fundamentals, major fundamental events last week frequently occurred. Federal Reserve Chairman Powell attended the semi-annual monetary policy hearing of the Senate and House of Representatives, reiterating that interest rates will not be cut rashly before economic data is clear, emphasizing that the current policy is still "relying on data" and it has not yet been decided whether to cut interest rates in July. He pointed out that the June-August data will be crucial, especially the actual impact of the tariffs on inflation. If its impact is lower than expected, it may provide room for the Fed to cut interest rates earlier. One of the reasons for maintaining interest rates is the uncertainty brought about by tariffs, and the economic fundamentals are still stable, so there is no need for an urgent interest rate cut. The current interest rate is in the "moderate restriction" range, rather than a "moderate restriction", and it is believed that the current balance sheet reduction rhythm can continue to be maintained and will not put pressure on the market, although the balance sheet size is still higher than the pre-epidemic level. The U.S. economic data has begun to show weak performance, with the final value of real GDP in the first quarter being revised down to -0.5% on an annualized basis, marking the first economic contraction in three years. The final value of personal consumption has been significantly lowered to only 0.5%, the weakest performance since the epidemic. In addition, the annual rate of the core PCE price index in the United States in May slightly exceeded expectations, reaching 2.7%, a record high since February 2025, but personal spending fell by 0.1% month-on-month, the largest drop since the beginning of the year. Data shows that the United StatesThe uncertainty of unified policies puts pressure on economic growth. Traders expect the Fed to start cutting interest rates in September, with the possibility of three cuts in 2025 increasing. There are differences within the Federal Reserve on the timing and amplitude of interest rate cuts. So last week, the US index market fell, and with the mediation of the United States and Qatar, Iran and Israel reached a ceasefire agreement this week, ending the fierce conflict that lasted 12 days. The EU-US trade negotiations have entered the final countdown. If the two sides fail to reach an agreement before July 9, the EU's tariffs on almost all goods exported by the United States will be significantly raised to 50%. European www.xmh100.commission President von der Leyen said that the EU has prepared for all possible outcomes, including the breakdown of the negotiations, and is currently evaluating the latest US tariff proposal and emphasizing that "all options are under consideration." The fundamentals of this week enter a new month, focusing mainly on the US June Chicago PMI at 21:45 on Monday. Then look at the US Dallas Fed Business Activity Index in June at 22:30. On Tuesday, we will pay attention to the initial value of the Eurozone June CPI annual rate at 17:00. Then look at the final value of the US S&P Global Manufacturing PMI in June at 21:45. Look at the 22:00 US June ISM Manufacturing PMI and US May JOLTs job openings and US May construction expenditure monthly rates. We focused on the number of U.S. ADP employment in June at 20:15 on Wednesday, and later on, the EIA crude oil inventories from the 22:30 on the week of June 27 and the EIA crude oil inventories from the week of June 27 to the week of June 27 and the EIA strategic oil reserve inventories from the week of June 27. Since Friday is the U.S. Independence Day, important fundamentals in the market have been transferred to Thursday. The main focus is on the unemployment rate in June of the United States, which is 20:30, the U.S. seasonally adjusted non-farm employment population in June and the U.S. initial unemployment claims for the week to June 28. This round is expected to be 4.2% and 129,000. Look at the final value of the US S&P Global Services PMI in June at 21:45 later. Then look at the US June ISM non-manufacturing PMI and US May factory order monthly rates at 22:00.
In terms of operation, gold: after opening high in the morning, it first falls back, and gives 3242 long stop loss 3237, the target is 3256 and 3265 and 3274 and 3283, and if it breaks, it looks like 3292 and 3300 leaving the market and backhanded.
Silver: 35.35 long stop loss this week at 35.15, with a target of 35.8 and 36.2 leaving the market.
Europe and the United States: 1.16950 more than 1.16750, the target is 1.17500 and 1.17750 and 1.18000.
U.S. crude oil: 66.8 short stop loss this week 67.1, the target is 66.2 and 66 and 65.5 and 65. If it falls below, it looks 64 and 63.
Nasdaq: 22450 more than 22380, the target is 22600 and 22700 and 22800.
The above content is all about "[XM Foreign Exchange Platform]: The weekly line is big negative to break support, and the gold and silver range is high in the sky", which is carefully organized by the editor of XM Foreign ExchangeEdited, I hope it will be helpful to your transaction! Thanks for the support!
After doing something, there will always be experience and lessons. In order to facilitate future work, we must analyze, study, summarize and concentrate the experience and lessons of previous work, and raise it to the theoretical level to understand it.
Disclaimers: XM Group only provides execution services and access permissions for online trading platforms, and allows individuals to view and/or use the website or the content provided on the website, but has no intention of making any changes or extensions, nor will it change or extend its services and access permissions. All access and usage permissions will be subject to the following terms and conditions: (i) Terms and conditions; (ii) Risk warning; And (iii) a complete disclaimer. Please note that all information provided on the website is for general informational purposes only. In addition, the content of all XM online trading platforms does not constitute, and cannot be used for any unauthorized financial market trading invitations and/or invitations. Financial market transactions pose significant risks to your investment capital.
All materials published on online trading platforms are only intended for educational/informational purposes and do not include or should be considered for financial, investment tax, or trading related consulting and advice, or transaction price records, or any financial product or non invitation related trading offers or invitations.
All content provided by XM and third-party suppliers on this website, including opinions, news, research, analysis, prices, other information, and third-party website links, remains unchanged and is provided as general market commentary rather than investment advice. All materials published on online trading platforms are only for educational/informational purposes and do not include or should be considered as applicable to financial, investment tax, or trading related advice and recommendations, or transaction price records, or any financial product or non invitation related financial offers or invitations. Please ensure that you have read and fully understood the information on XM's non independent investment research tips and risk warnings. For more details, please click here
CATEGORIES
News
- 【XM Market Review】--Gold Forex Signal: Reaching Towards the All-Time High
- 【XM Market Review】--EUR/USD Forecast: Faces Resistance Near 1.06
- 【XM Market Analysis】--Silver Forecast: Bounces at Crucial 200 Day EMA
- 【XM Group】--EUR/USD Forecast: Looking for a Breakout
- 【XM Market Analysis】--BTC/USD Forecast: Bitcoin Steady Near $100K