


Trusted by over 15 Million Traders
The Most Awarded Broker
for a Reason
Easy Access to 1,400+ Global Assets
EURUSD
Euro vs U.S. Dollar
US500
S&P 500 (US500)
GOLD
Gold
COFFEE
US Coffee
Apple
Apple (AAPL.OQ)
-

Finance Magnates 颁发
-

Finance Magnates 颁发
-

Capital Finance International Magazine (CFI.co) 2024年颁赠
-

COLWMA 2024年颁赠
-

荣获World Finance Forex Awards 2023最佳外汇客户服务奖
-

荣获World Finance Forex Awards 2023欧洲最佳外汇经纪商奖
-

荣获World Finance Forex Awards 2023澳大拉西亚最佳外汇经纪商奖
-

荣获World Finance Forex Awards 2023拉丁美洲最佳外汇经纪商奖
-

荣获World Finance Forex Awards 2023中东最佳外汇经纪商奖
-

CFI.co于2023年颁赠
-

荣获2023年City of London Wealth Management Awards
-

荣获2022年埃及金融博览会颁赠
-

荣获2022年City of London Wealth Management Awards
-

CFI.co于2022年颁赠
-

荣获Global Forex Awards 2022 — 零售外汇 颁赠
-
2021年迪拜外汇博览会获颁赠
-

Ultimate Fintech 2021年颁赠
-

荣获2021年City of London Wealth Management Awards
-

FX168于2020年12月颁赠
-

荣获Global Business Awards 2020
-

荣获2020年City of London Wealth Management Awards
-

Capital Finance International Magazine (CFI.co)颁赠
-

Capital Finance International Magazine (CFI.co)颁赠
-

荣获2019年City of London Wealth Management Awards
-

Shares Magazine 授予 UK Forex Awards 2018
-

Capital Finance International Magazine (CFI.co)颁赠
-

Capital Finance International Magazine (CFI.co)颁赠
-

2017年伦敦财富管理奖
-

2016最佳本土 客户服务
-

中东和北非地区(MENA)增长最快的经纪商
-
2015年最佳外汇科技提供商
-
2014年最佳外汇科技提供商
-

2014年最佳外汇科技提供商
-

荣获 The Trading Show 2024年非洲 Africa Fintech 峰会颁赠
-

荣获2024年中东地区 Brokersview 颁赠
-
荣获2024年中东地区 Brokersview 颁赠
-

荣获2024年阿曼 Smart Vision 峰会颁赠
-

荣获2024年迪拜外汇博览会颁赠
-

荣获2024年迪拜 Forex Traders Summit 颁赠
-

2024年埃及 Smart Vision 峰会颁赠
-

投查查于2024年颁赠
-

Capital Finance International Magazine (CFI.co) 2024年颁赠
-

CFI.co于2023年颁赠
-

CFI.co于2023年颁赠
-

交易社区平台FOLLOWME于2022年颁赠
-
2022年迪拜Forex Expo获颁赠
-
2022年迪拜Forex Expo获颁赠
-

荣获Global Forex Awards 2022 — 零售外汇 颁赠
-

CFI.co于2022年颁赠
-

CFI.co于2022年颁赠
-

World Finance Forex Awards 2022 颁发
-

World Finance Forex Awards 2022 颁发
-

World Finance Forex Awards 2022 颁发
-

World Finance Forex Awards 2022 颁发
-
交易社区平台FOLLOWME于2021年颁赠
-

2021年埃及Smart Vision Investment Expo博览会获颁赠
-

CFI.co于2021年颁赠
-

CFI.co于2021年颁赠
-

荣获Global Forex Awards 2021 — 零售外汇 颁赠
-

荣获Global Forex Awards 2021 — 零售外汇 颁赠
-

World Finance 2021颁发
-

World Finance 2021颁发
-
FOLLOWME于2021年颁赠
-

Global Forex Awards 2021 — B2B 颁赠
-

Global Forex Awards颁赠
-

Global Forex Awards颁赠
-

CFI.co于2020年颁赠
-

CFI.co于2020年颁赠
-

荣获Global Business Awards 2020
-

World Finance Magazine 颁赠
World Finance Forex Awards 2020 -

World Finance Magazine 颁赠
World Finance Forex Awards 2020 -
FOLLOWME交易社区授予
-

Global Forex Awards颁赠
-

Global Forex Awards颁赠
-

FinTech Age Awards颁发
-

World Finance Magazine 颁赠
World Finance Forex Awards 2019 -

World Finance Magazine 颁赠
World Finance Forex Awards 2019 -

荣获 World Finance Forex Awards 2018 颁赠
-

荣获2018年埃及金融博览会颁赠
-

荣获 Shares Magazine 的 UK Forex Awards 2017 颁赠
-

荣获 World Finance Forex Awards 2017
-

2016年最佳黄金经纪商
-

2016年最佳外汇经纪商
-

2015年最佳本地客户服务
-

Global Brands Magazine 颁赠
-

Online Money Awards 2022 颁发
-

荣获2022年埃及金融博览会颁赠
-

2015最佳外汇交易平台
-

2015最佳金融交易平台
-

2013最佳创新外汇平台奖
-

2020年 Cyprus HR Awards 颁赠
-

金融行业的佼佼者
-

认证最优金牌级别
-

2014年首届亚军
-
Finance Magnates 颁发
-
Finance Magnates 颁发
-
Capital Finance International Magazine (CFI.co) 2024年颁赠
-
COLWMA 2024年颁赠
-
荣获World Finance Forex Awards 2023最佳外汇客户服务奖
-
荣获World Finance Forex Awards 2023欧洲最佳外汇经纪商奖
-
荣获World Finance Forex Awards 2023澳大拉西亚最佳外汇经纪商奖
-
荣获World Finance Forex Awards 2023拉丁美洲最佳外汇经纪商奖
-
荣获World Finance Forex Awards 2023中东最佳外汇经纪商奖
-
CFI.co于2023年颁赠
-
荣获2023年City of London Wealth Management Awards
-
荣获2022年埃及金融博览会颁赠
-
荣获2022年City of London Wealth Management Awards
-
CFI.co于2022年颁赠
-
荣获Global Forex Awards 2022 — 零售外汇 颁赠
-
2021年迪拜外汇博览会获颁赠
-
Ultimate Fintech 2021年颁赠
-
荣获2021年City of London Wealth Management Awards
-
FX168于2020年12月颁赠
-
荣获Global Business Awards 2020
-
荣获2020年City of London Wealth Management Awards
-
Capital Finance International Magazine (CFI.co)颁赠
-
Capital Finance International Magazine (CFI.co)颁赠
-
荣获2019年City of London Wealth Management Awards
-
Shares Magazine 授予 UK Forex Awards 2018
-
Capital Finance International Magazine (CFI.co)颁赠
-
Capital Finance International Magazine (CFI.co)颁赠
-
2017年伦敦财富管理奖
-
2016最佳本土 客户服务
-
中东和北非地区(MENA)增长最快的经纪商
-
2015年最佳外汇科技提供商
-
2014年最佳外汇科技提供商
-
2014年最佳外汇科技提供商
-
荣获 The Trading Show 2024年非洲 Africa Fintech 峰会颁赠
-
荣获2024年中东地区 Brokersview 颁赠
-
荣获2024年中东地区 Brokersview 颁赠
-
荣获2024年阿曼 Smart Vision 峰会颁赠
-
荣获2024年迪拜外汇博览会颁赠
-
荣获2024年迪拜 Forex Traders Summit 颁赠
-
2024年埃及 Smart Vision 峰会颁赠
-
投查查于2024年颁赠
-
Capital Finance International Magazine (CFI.co) 2024年颁赠
-
CFI.co于2023年颁赠
-
CFI.co于2023年颁赠
-
交易社区平台FOLLOWME于2022年颁赠
-
2022年迪拜Forex Expo获颁赠
-
2022年迪拜Forex Expo获颁赠
-
荣获Global Forex Awards 2022 — 零售外汇 颁赠
-
CFI.co于2022年颁赠
-
CFI.co于2022年颁赠
-
World Finance Forex Awards 2022 颁发
-
World Finance Forex Awards 2022 颁发
-
World Finance Forex Awards 2022 颁发
-
World Finance Forex Awards 2022 颁发
-
交易社区平台FOLLOWME于2021年颁赠
-
2021年埃及Smart Vision Investment Expo博览会获颁赠
-
CFI.co于2021年颁赠
-
CFI.co于2021年颁赠
-
荣获Global Forex Awards 2021 — 零售外汇 颁赠
-
荣获Global Forex Awards 2021 — 零售外汇 颁赠
-
World Finance 2021颁发
-
World Finance 2021颁发
-
FOLLOWME于2021年颁赠
-
Global Forex Awards 2021 — B2B 颁赠
-
Global Forex Awards颁赠
-
Global Forex Awards颁赠
-
CFI.co于2020年颁赠
-
CFI.co于2020年颁赠
-
荣获Global Business Awards 2020
-
World Finance Magazine 颁赠
World Finance Forex Awards 2020 -
World Finance Magazine 颁赠
World Finance Forex Awards 2020 -
FOLLOWME交易社区授予
-
Global Forex Awards颁赠
-
Global Forex Awards颁赠
-
FinTech Age Awards颁发
-
World Finance Magazine 颁赠
World Finance Forex Awards 2019 -
World Finance Magazine 颁赠
World Finance Forex Awards 2019 -
荣获 World Finance Forex Awards 2018 颁赠
-
荣获2018年埃及金融博览会颁赠
-
荣获 Shares Magazine 的 UK Forex Awards 2017 颁赠
-
荣获 World Finance Forex Awards 2017
-
2016年最佳黄金经纪商
-
2016年最佳外汇经纪商
-
2015年最佳本地客户服务
-
Global Brands Magazine 颁赠
-
Online Money Awards 2022 颁发
-
荣获2022年埃及金融博览会颁赠
-
2015最佳外汇交易平台
-
2015最佳金融交易平台
-
2013最佳创新外汇平台奖
-
2020年 Cyprus HR Awards 颁赠
-
金融行业的佼佼者
-
认证最优金牌级别
-
2014年首届亚军

Awarded BestBrokerYear After Year
market analysis
Gold 3300 is a short-term watershed, and the lows in the early trading of Europe and the United States become the key
Wonderful introduction:
Walk out of the thorns, there is a bright road covered with flowers; when you reach the top of the mountain, you will see the cloudy mountain scenery like green clouds. In this world, a star falls and cannot dim the starry sky, a flower withers and cannot desolate the whole spring.
Hello everyone, today XM Foreign Exchange will bring you "[XM Official Website]: Gold 3300 is a short-term watershed, and the lows in the early trading of Europe and the United States become the key." Hope it will be helpful to you! The original content is as follows:
Macro
Spot gold fell sharply by 2% last Friday, hitting a nearly one-month low, with a weekly decline of 2.8%, down for two consecutive weeks. However, gold prices in the Asian market bottomed out and rebounded in the early trading session on Monday, showing resilience, highlighting the market's game between risk aversion and risk preferences. The U.S. non-farm employment report will become the key this week. The Sino-US rare earth trade agreement and the G7 tax agreement boosted global stock markets and weakened the attractiveness of gold safe-haven. The Trump administration's tariff policy caused US consumer spending to fall in May, and weak economic data intensified the Fed's expectation of a rate cut. The probability of a rate cut in September reached 92.5%, and the low interest rate environment is good for gold prices. In terms of geopolitical aspects, the repeated situation in Iran and the Israeli raid on Syria have pushed up risk aversion sentiment, providing long-term support for gold prices. Gold is currently affected by multiple factors. A series of key events and data this week will affect the Fed's policy path, which will in turn affect the gold price and the market may continue to fluctuate. Investors need to respond cautiously.
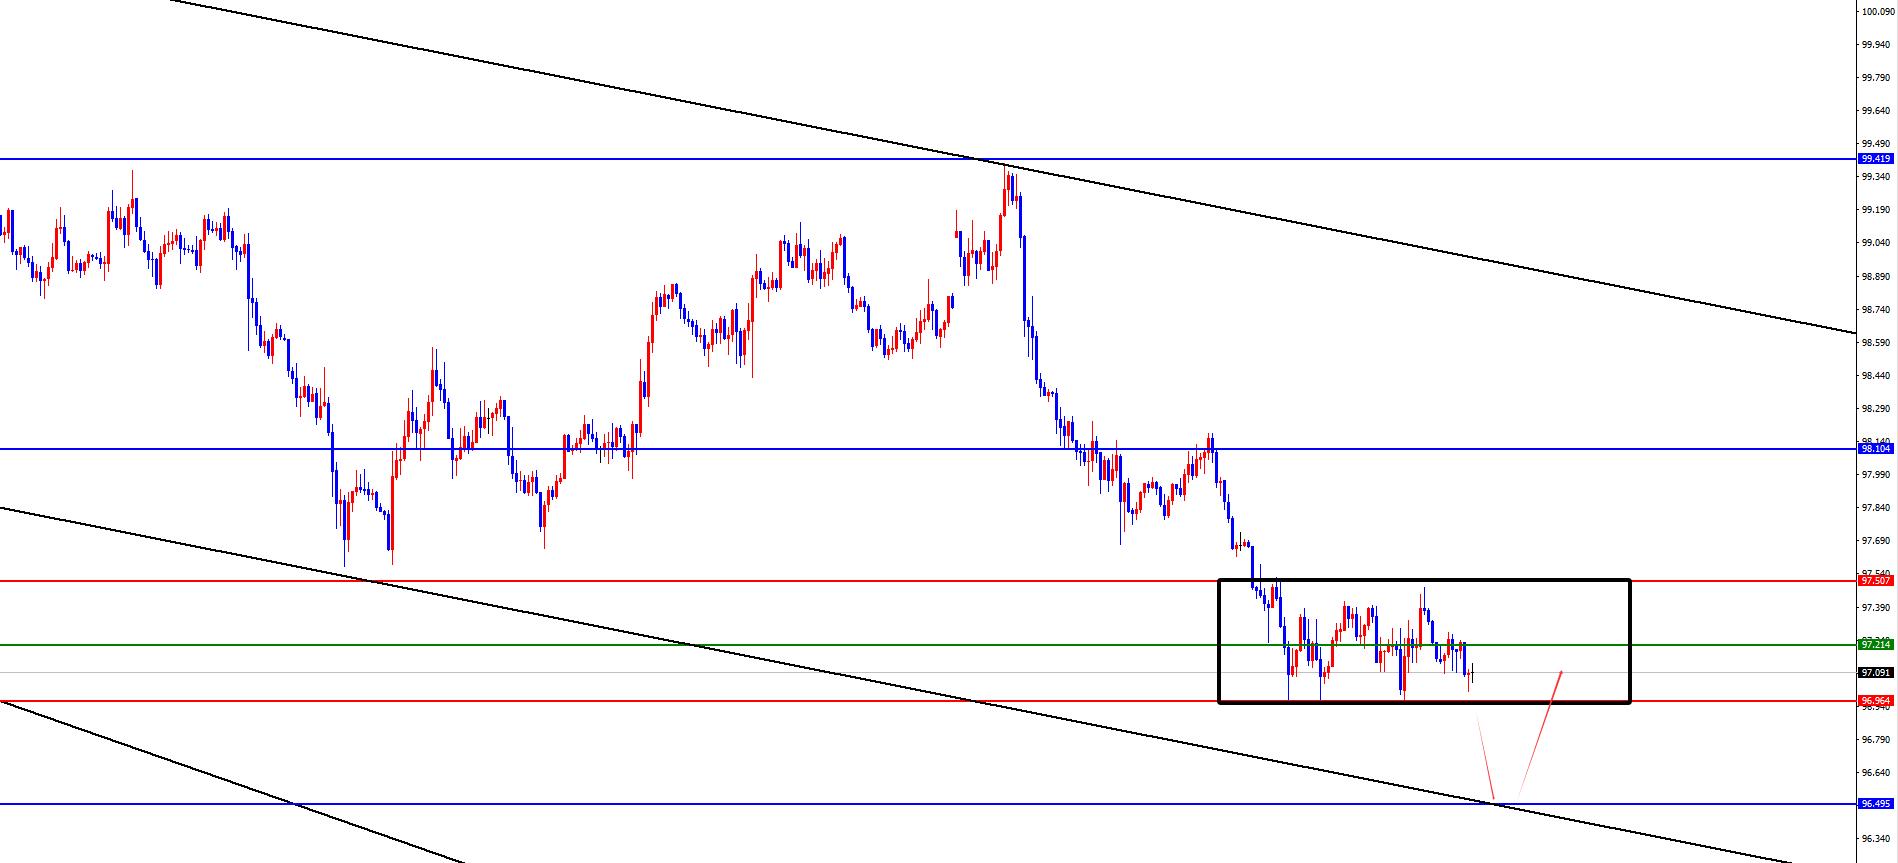
Dollar Index
In terms of the performance of the US dollar index, the US dollar index showed a downward trend last Friday. The price of the US dollar index rose to 97.479 on the day, and fell to 96.966 at the lowest, and finally closed at 97.228. Looking back at the market performance last Friday, after the price rebounded slightly during the early trading session, the price was under pressure again, and the price did not break the low point on Thursday. After that, the US market bottomed out and rebounded again, but the price was still suppressed at the four-hour resistance position. Finally, the closing closed at the cross and the weekly line ended with a big negative end. In response to the subsequent needs, we need to pay attention to the gains and losses of support near the trend line.
From a multi-cycle analysis, the price is suppressed in the 99.40 area resistance at the weekly level, so from a medium-term perspective, the trend of the US dollar index will be more bearish. At the daily levelAs time goes by, the key price resistance position is at 98.10. The current price is below this position, so we need to pay attention to further continuation for the time being, but the current price is close to the support area of the upward trend line, so we need to pay attention to the support situation of the trend line in the future. At the same time, the price continues to be under pressure over the four hours. In the short term, we need to pay attention to the resistance in the 97.20 area. In the four hours, we need to pay attention to the range of 96.95-97.50. After the price breaks, the short term continues. Therefore, although it is relatively short for the time being, we need to pay attention to the market bottoming out and rebounding performance. In addition, from the short-term downward channel, the 96.50 area below is also the lower edge of the channel, so we need to focus on this position to support the rise in the future.
The US dollar index has a long range of 96.40-50, with a defense of 5 US dollars, and a target of 96.90-97.50
Gold
In terms of gold, the overall price of gold showed a decline last Friday, with the highest price rising to 3327.78 on the day, and the lowest price fell to 3255.68 on the spot, closing at 3274.43 on the spot. In response to the direct weak pressure of gold during the early trading session last Friday, the price has been running weakly all the way, and as the author said, testing the weekly support position, the weekly line ended in the end, and then the pressure will be underway according to the previous idea. The upper part focuses on the daily resistance area.
From multi-cycle analysis, first observe the monthly rhythm. The price will run at the rhythm in May as the author said, and the final cross state. For this month's price continues to fluctuate at a high level as scheduled. Today is the last trading day in June. For the current situation, the market is expected to continue to reverse K and end. From the weekly level, last week's price was tested to the weekly support area as the author said. At present, short-term attention will continue to break the weekly support after adjustment. With the passage of time, the weekly support will be at the 3285 watershed. According to the daily level, after the price fell below the daily support last week, the price continued to be under pressure based on the daily resistance. At present, the daily resistance is at the 3355 area resistance. At this point, gold can continue to be short-term in the band. According to the four-hour level, the key position of the four-hour is the key to our emphasis on short-term trends. The current four-hour watershed is in the 3300 area, so we currently focus on the gains and losses of this position. Before the break is higher, we should first look at the pressure in the short term, but once the break is higher, we need to pay attention to the rebound to the daily resistance in the future. From an hour's perspective, the bottoming out during the morning session and rebounded and broke through the high point of the retracement in the early morning of the previous trading day, so the short-term adjustment is still in progress. Pay attention to the gains and losses of the 3300 position for the time being, and treat it according to the right-hand trading method.
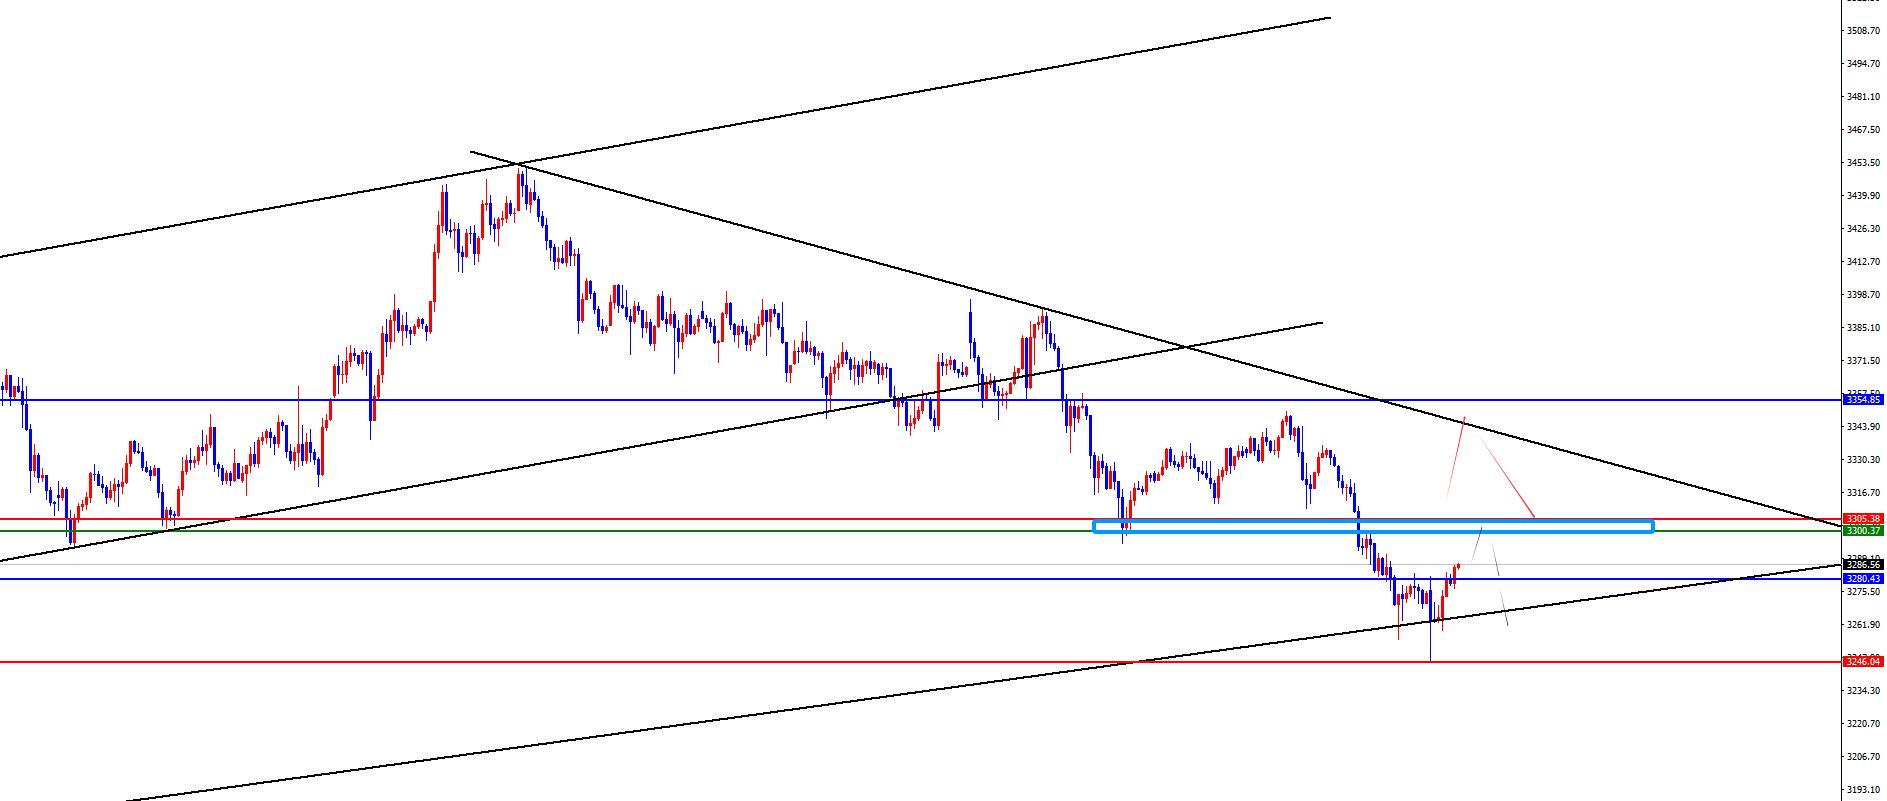
Gold pays attention to the 3300 watershed, and treats the right-hand trading method
European and the United States
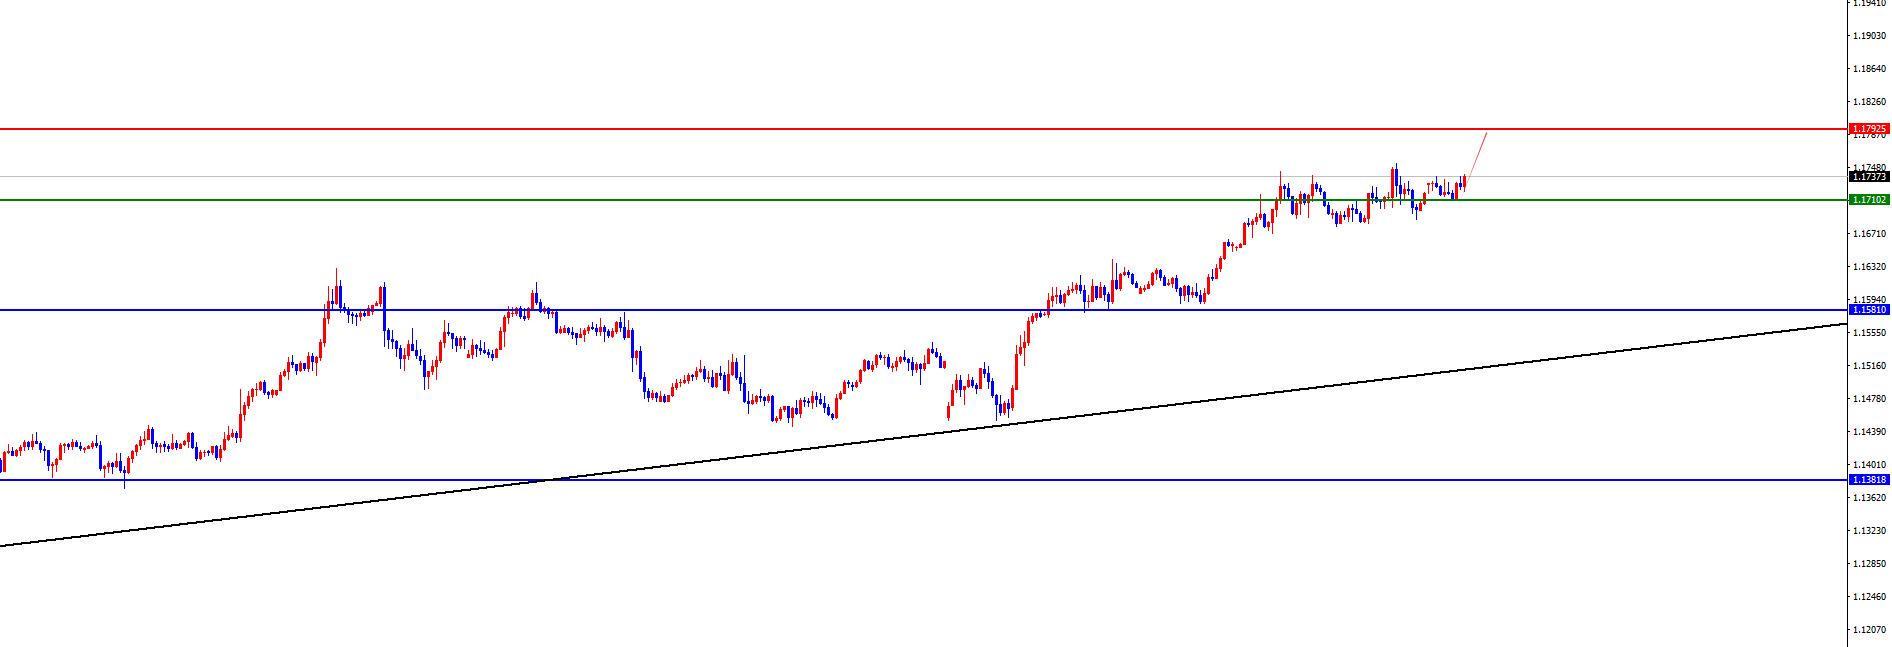
European and the United States, the prices of Europe and the United States overall showed an upward trend last Friday. The price fell to 1.1680 on the day and rose to 1.1753 on the spot and closed at 1.1719 on the spot. Looking back at the performance of European and American markets last Friday, prices rose again after a short-term fluctuation in the early trading session, and once again hit the weekly high point in the European trading session. Although they fluctuated later, they still ended with a big sun. In the future, we will still treat it more.
From a multi-cycle analysis, from the perspective of the monthly line level, Europe and the United States are supported at 1.0850, so long-term bulls are treated, and the monthly line will close today, so focus on closing performance. From the weekly level, the price is supported by the 1.1380 area, and from the perspective of the mid-line, the price decline is temporarily treated as a correction in the mid-line rise. From the daily level, as time goes by, we need to focus on the 1.1580 regional watershed, and the temporary band above this position is treated more frequently. From the four-hour level, you need to pay attention to the 1.1710 regional support for the time being. This position is the key to the short-term trend, and the price can be treated more than the price above this position.
Europe and the United States have a range of 1.1710-20, with a defense of 40 points, and a target of 1.1790
[Finance data and events that are focused today] Monday, June 30, 2025
① To be determined by the European Central Bank forum
②14:00 UK's first quarter GDP annual rate final value
③14:00 UK's first quarter current account
④15:00 Switzerland's June KOF economic leading indicator
⑤16:30 UK's May central bank mortgage loan license
⑥ 20:00 The initial monthly value of the CPI rate in June of Germany
⑦21:45 The United States Chicago PMI in June
⑧22:00 The Federal Reserve Bostic delivered a speech
⑨22:30 The United States Dallas Fed Business Activity Index in June
⑩ The next day, the Federal Reserve Goulsby delivered a speech
03:00 the next day, the European Central Bank Governor Lagarde made a speech
Note: The above is only personal opinions and strategies, for reference and www.xmh100.communication only, and does not give customers any investment advice. It has nothing to do with customers' investment, and is not used as a basis for placing an order.
The above content is all about "[XM official website]: Gold 3300 is a short-term watershed, and the low points in the early trading in Europe and the United States become the key". It is carefully www.xmh100.compiled and edited by the editor of XM Forex. I hope it will be helpful to your trading! Thanks for the support!
After doing something, there will always be experience and lessons. In order to facilitate future work, we must analyze, study, summarize and concentrate the experience and lessons of previous work, and raise it to the theoretical level to understand it.
Disclaimers: XM Group only provides execution services and access permissions for online trading platforms, and allows individuals to view and/or use the website or the content provided on the website, but has no intention of making any changes or extensions, nor will it change or extend its services and access permissions. All access and usage permissions will be subject to the following terms and conditions: (i) Terms and conditions; (ii) Risk warning; And (iii) a complete disclaimer. Please note that all information provided on the website is for general informational purposes only. In addition, the content of all XM online trading platforms does not constitute, and cannot be used for any unauthorized financial market trading invitations and/or invitations. Financial market transactions pose significant risks to your investment capital.
All materials published on online trading platforms are only intended for educational/informational purposes and do not include or should be considered for financial, investment tax, or trading related consulting and advice, or transaction price records, or any financial product or non invitation related trading offers or invitations.
All content provided by XM and third-party suppliers on this website, including opinions, news, research, analysis, prices, other information, and third-party website links, remains unchanged and is provided as general market commentary rather than investment advice. All materials published on online trading platforms are only for educational/informational purposes and do not include or should be considered as applicable to financial, investment tax, or trading related advice and recommendations, or transaction price records, or any financial product or non invitation related financial offers or invitations. Please ensure that you have read and fully understood the information on XM's non independent investment research tips and risk warnings. For more details, please click here
CATEGORIES
News
- 【XM Decision Analysis】--USD/TRY Forecast: Lira Stabilization Expected After Trea
- 【XM Market Analysis】--USD/CHF Forecast: US Dollar Continues to Chop Against Swis
- 【XM Forex】--USD/BRL Analysis: Hits New Lows Amid Market Calm
- 【XM Market Analysis】--EUR/USD Forex Signal: Stuck in a Range, a Pullback to 1.03
- 【XM Market Analysis】--EUR/USD Forecast: Slides After Dovish ECB Rate Cut