


Trusted by over 15 Million Traders
The Most Awarded Broker
for a Reason
Easy Access to 1,400+ Global Assets
EURUSD
Euro vs U.S. Dollar
US500
S&P 500 (US500)
GOLD
Gold
COFFEE
US Coffee
Apple
Apple (AAPL.OQ)
-

Finance Magnates 颁发
-

Finance Magnates 颁发
-

Capital Finance International Magazine (CFI.co) 2024年颁赠
-

COLWMA 2024年颁赠
-

荣获World Finance Forex Awards 2023最佳外汇客户服务奖
-

荣获World Finance Forex Awards 2023欧洲最佳外汇经纪商奖
-

荣获World Finance Forex Awards 2023澳大拉西亚最佳外汇经纪商奖
-

荣获World Finance Forex Awards 2023拉丁美洲最佳外汇经纪商奖
-

荣获World Finance Forex Awards 2023中东最佳外汇经纪商奖
-

CFI.co于2023年颁赠
-

荣获2023年City of London Wealth Management Awards
-

荣获2022年埃及金融博览会颁赠
-

荣获2022年City of London Wealth Management Awards
-

CFI.co于2022年颁赠
-

荣获Global Forex Awards 2022 — 零售外汇 颁赠
-
2021年迪拜外汇博览会获颁赠
-

Ultimate Fintech 2021年颁赠
-

荣获2021年City of London Wealth Management Awards
-

FX168于2020年12月颁赠
-

荣获Global Business Awards 2020
-

荣获2020年City of London Wealth Management Awards
-

Capital Finance International Magazine (CFI.co)颁赠
-

Capital Finance International Magazine (CFI.co)颁赠
-

荣获2019年City of London Wealth Management Awards
-

Shares Magazine 授予 UK Forex Awards 2018
-

Capital Finance International Magazine (CFI.co)颁赠
-

Capital Finance International Magazine (CFI.co)颁赠
-

2017年伦敦财富管理奖
-

2016最佳本土 客户服务
-

中东和北非地区(MENA)增长最快的经纪商
-
2015年最佳外汇科技提供商
-
2014年最佳外汇科技提供商
-

2014年最佳外汇科技提供商
-

荣获 The Trading Show 2024年非洲 Africa Fintech 峰会颁赠
-

荣获2024年中东地区 Brokersview 颁赠
-
荣获2024年中东地区 Brokersview 颁赠
-

荣获2024年阿曼 Smart Vision 峰会颁赠
-

荣获2024年迪拜外汇博览会颁赠
-

荣获2024年迪拜 Forex Traders Summit 颁赠
-

2024年埃及 Smart Vision 峰会颁赠
-

投查查于2024年颁赠
-

Capital Finance International Magazine (CFI.co) 2024年颁赠
-

CFI.co于2023年颁赠
-

CFI.co于2023年颁赠
-

交易社区平台FOLLOWME于2022年颁赠
-
2022年迪拜Forex Expo获颁赠
-
2022年迪拜Forex Expo获颁赠
-

荣获Global Forex Awards 2022 — 零售外汇 颁赠
-

CFI.co于2022年颁赠
-

CFI.co于2022年颁赠
-

World Finance Forex Awards 2022 颁发
-

World Finance Forex Awards 2022 颁发
-

World Finance Forex Awards 2022 颁发
-

World Finance Forex Awards 2022 颁发
-
交易社区平台FOLLOWME于2021年颁赠
-

2021年埃及Smart Vision Investment Expo博览会获颁赠
-

CFI.co于2021年颁赠
-

CFI.co于2021年颁赠
-

荣获Global Forex Awards 2021 — 零售外汇 颁赠
-

荣获Global Forex Awards 2021 — 零售外汇 颁赠
-

World Finance 2021颁发
-

World Finance 2021颁发
-
FOLLOWME于2021年颁赠
-

Global Forex Awards 2021 — B2B 颁赠
-

Global Forex Awards颁赠
-

Global Forex Awards颁赠
-

CFI.co于2020年颁赠
-

CFI.co于2020年颁赠
-

荣获Global Business Awards 2020
-

World Finance Magazine 颁赠
World Finance Forex Awards 2020 -

World Finance Magazine 颁赠
World Finance Forex Awards 2020 -
FOLLOWME交易社区授予
-

Global Forex Awards颁赠
-

Global Forex Awards颁赠
-

FinTech Age Awards颁发
-

World Finance Magazine 颁赠
World Finance Forex Awards 2019 -

World Finance Magazine 颁赠
World Finance Forex Awards 2019 -

荣获 World Finance Forex Awards 2018 颁赠
-

荣获2018年埃及金融博览会颁赠
-

荣获 Shares Magazine 的 UK Forex Awards 2017 颁赠
-

荣获 World Finance Forex Awards 2017
-

2016年最佳黄金经纪商
-

2016年最佳外汇经纪商
-

2015年最佳本地客户服务
-

Global Brands Magazine 颁赠
-

Online Money Awards 2022 颁发
-

荣获2022年埃及金融博览会颁赠
-

2015最佳外汇交易平台
-

2015最佳金融交易平台
-

2013最佳创新外汇平台奖
-

2020年 Cyprus HR Awards 颁赠
-

金融行业的佼佼者
-

认证最优金牌级别
-

2014年首届亚军
-
Finance Magnates 颁发
-
Finance Magnates 颁发
-
Capital Finance International Magazine (CFI.co) 2024年颁赠
-
COLWMA 2024年颁赠
-
荣获World Finance Forex Awards 2023最佳外汇客户服务奖
-
荣获World Finance Forex Awards 2023欧洲最佳外汇经纪商奖
-
荣获World Finance Forex Awards 2023澳大拉西亚最佳外汇经纪商奖
-
荣获World Finance Forex Awards 2023拉丁美洲最佳外汇经纪商奖
-
荣获World Finance Forex Awards 2023中东最佳外汇经纪商奖
-
CFI.co于2023年颁赠
-
荣获2023年City of London Wealth Management Awards
-
荣获2022年埃及金融博览会颁赠
-
荣获2022年City of London Wealth Management Awards
-
CFI.co于2022年颁赠
-
荣获Global Forex Awards 2022 — 零售外汇 颁赠
-
2021年迪拜外汇博览会获颁赠
-
Ultimate Fintech 2021年颁赠
-
荣获2021年City of London Wealth Management Awards
-
FX168于2020年12月颁赠
-
荣获Global Business Awards 2020
-
荣获2020年City of London Wealth Management Awards
-
Capital Finance International Magazine (CFI.co)颁赠
-
Capital Finance International Magazine (CFI.co)颁赠
-
荣获2019年City of London Wealth Management Awards
-
Shares Magazine 授予 UK Forex Awards 2018
-
Capital Finance International Magazine (CFI.co)颁赠
-
Capital Finance International Magazine (CFI.co)颁赠
-
2017年伦敦财富管理奖
-
2016最佳本土 客户服务
-
中东和北非地区(MENA)增长最快的经纪商
-
2015年最佳外汇科技提供商
-
2014年最佳外汇科技提供商
-
2014年最佳外汇科技提供商
-
荣获 The Trading Show 2024年非洲 Africa Fintech 峰会颁赠
-
荣获2024年中东地区 Brokersview 颁赠
-
荣获2024年中东地区 Brokersview 颁赠
-
荣获2024年阿曼 Smart Vision 峰会颁赠
-
荣获2024年迪拜外汇博览会颁赠
-
荣获2024年迪拜 Forex Traders Summit 颁赠
-
2024年埃及 Smart Vision 峰会颁赠
-
投查查于2024年颁赠
-
Capital Finance International Magazine (CFI.co) 2024年颁赠
-
CFI.co于2023年颁赠
-
CFI.co于2023年颁赠
-
交易社区平台FOLLOWME于2022年颁赠
-
2022年迪拜Forex Expo获颁赠
-
2022年迪拜Forex Expo获颁赠
-
荣获Global Forex Awards 2022 — 零售外汇 颁赠
-
CFI.co于2022年颁赠
-
CFI.co于2022年颁赠
-
World Finance Forex Awards 2022 颁发
-
World Finance Forex Awards 2022 颁发
-
World Finance Forex Awards 2022 颁发
-
World Finance Forex Awards 2022 颁发
-
交易社区平台FOLLOWME于2021年颁赠
-
2021年埃及Smart Vision Investment Expo博览会获颁赠
-
CFI.co于2021年颁赠
-
CFI.co于2021年颁赠
-
荣获Global Forex Awards 2021 — 零售外汇 颁赠
-
荣获Global Forex Awards 2021 — 零售外汇 颁赠
-
World Finance 2021颁发
-
World Finance 2021颁发
-
FOLLOWME于2021年颁赠
-
Global Forex Awards 2021 — B2B 颁赠
-
Global Forex Awards颁赠
-
Global Forex Awards颁赠
-
CFI.co于2020年颁赠
-
CFI.co于2020年颁赠
-
荣获Global Business Awards 2020
-
World Finance Magazine 颁赠
World Finance Forex Awards 2020 -
World Finance Magazine 颁赠
World Finance Forex Awards 2020 -
FOLLOWME交易社区授予
-
Global Forex Awards颁赠
-
Global Forex Awards颁赠
-
FinTech Age Awards颁发
-
World Finance Magazine 颁赠
World Finance Forex Awards 2019 -
World Finance Magazine 颁赠
World Finance Forex Awards 2019 -
荣获 World Finance Forex Awards 2018 颁赠
-
荣获2018年埃及金融博览会颁赠
-
荣获 Shares Magazine 的 UK Forex Awards 2017 颁赠
-
荣获 World Finance Forex Awards 2017
-
2016年最佳黄金经纪商
-
2016年最佳外汇经纪商
-
2015年最佳本地客户服务
-
Global Brands Magazine 颁赠
-
Online Money Awards 2022 颁发
-
荣获2022年埃及金融博览会颁赠
-
2015最佳外汇交易平台
-
2015最佳金融交易平台
-
2013最佳创新外汇平台奖
-
2020年 Cyprus HR Awards 颁赠
-
金融行业的佼佼者
-
认证最优金牌级别
-
2014年首届亚军

Awarded BestBrokerYear After Year
market news
ADP recorded negative values, waiting for non-agricultural data to perform
Wonderful introduction:
Let your sorrows be full of worries, and you can't sleep, and you can't sleep. The full moon hangs high, scattered all over the ground. I think that the bright moon will be ruthless, and the wind and frost will fade away for thousands of years, and the passion will fade away easily. If there is love, it should have grown old with the wind. Knowing that the moon is ruthless, why do you repeatedly express your love to the bright moon?
Hello everyone, today XM Foreign Exchange will bring you "[XM Foreign Exchange Decision Analysis]: ADP recorded a negative value, wait for the performance of non-agricultural data." Hope it will be helpful to you! The original content is as follows:
Macro
Gold price rose three consecutive times on Wednesday, up 0.5%, mainly due to the unexpected weakness of US ADP employment data, which triggered the market's expectations of the Federal Reserve's early interest rate cuts. In June, private employment in the United States decreased by 33,000, far lower than expected, an increase of 95,000. Jobs in multiple industries decreased significantly, and uncertainty in the employment market was highlighted. This weak data has driven the market to increase bets on the Fed's interest rate cut, with the likelihood of a rate cut in July rising to 23%, and the probability of a 25 basis point cut in September reaching 92.5%. Lower interest rates reduce the opportunity cost of holding gold, prompting gold prices to rise. The upcoming non-farm employment report on Thursday became the key, with the market expecting 110,000 jobs to increase and the unemployment rate to 4.3%, and Goldman Sachs' forecast is even more pessimistic. The result will directly affect the Federal Reserve's monetary policy and influence the trend of gold prices. In addition, easing of global trade situations and tensions coexist, and the US fiscal policy may significantly increase debt, all of which have had www.xmh100.complex impacts on the gold market. Despite the resilience of the labor market, recruitment has slowed. Investors need to pay attention to non-agricultural data, policies and trade trends, and the long-term value of gold is still worth looking forward to.
Dollar Index
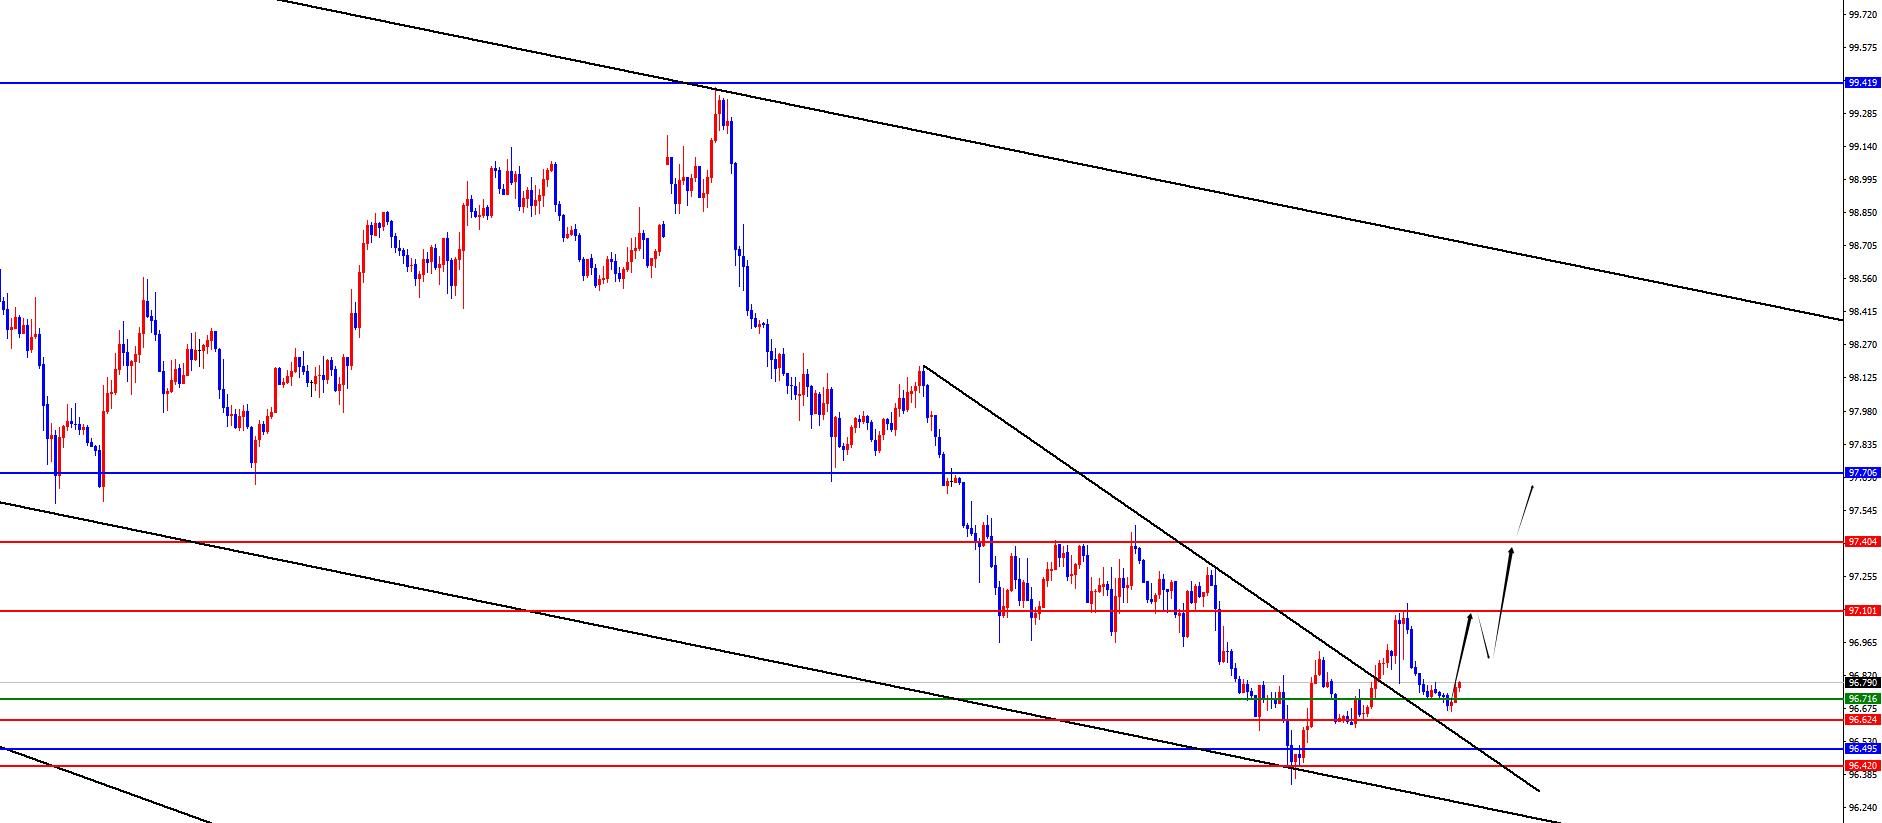
In terms of the performance of the US dollar index, the US dollar index showed an upward trend on Wednesday. The price of the US dollar index rose to 97.137 on the day, and fell to 96.593 at the lowest, and finally closed at 96.755. Looking back on the market performance on Tuesday, the price fluctuated first and then gained support and rose again during the early trading session. At the same time, it broke through the four-hour resistance position in the European session. After that, the price continued to rise. Although the price was under pressure and fell during the overnight period, the positive line ended in the end. The price was just as the author received support near the trend line on Tuesday. Pay attention to further follow-up attention.Upward performance.
From a multi-cycle analysis, the price is suppressed in the 99.40 area resistance at the weekly level, so from a medium-term perspective, the trend of the US dollar index will be more bearish. At the daily level, the key price resistance position is at 97.70 position over time. The current price is below this position, so we need to pay attention to further continuation for the time being, but the price stops rising after testing the channel line. In the future, we need to pay attention to further testing the daily resistance performance. At the same time, the price rose after reaching the channel line in the four-hour period. Currently, the price is still above the four-hour period. Today, we are paying attention to the range of 96.60-70. The price is more likely to be treated at this position. Focus on 97.10-97.40 above. If it is very strong, focus on the daily resistance around 97.70.
The US dollar index has a long range of 96.60-70, with a defense of 5 US dollars, and a target of 97.10-97.40-97.70
Gold
In terms of gold, the overall price of gold showed an upward trend on Wednesday. The price rose to the highest point of 3359.87 on the day, and fell to the lowest point of 3327.47 on the spot, closing at 3356.88. Regarding Wednesday, gold fell under pressure during the early trading session, and then tested it to four-hour support before stopping to rise. The time point rose in the European session, and the price continued after the US session, and finally the big sun ended on the same day. In response to the current key resistance range above, and in www.xmh100.combination with the large cycle, we need to pay attention to further pressure. The short-term low today's morning trading low has become a key watershed. Once it breaks down, we will pay attention to further continuation in the future.
From multi-cycle analysis, first observe the monthly rhythm. The price runs at the rhythm in May as the author said, and the final cross state. The final price in June is still in an anti-K state, so you still need to be cautious when dealing with the majority. From the weekly level, last week's price was tested to the weekly support area as the author said. After short-term adjustment, it will continue to break the weekly support. Over time, the weekly support will be at the 3290 watershed. According to the daily level, after the price fell below the daily support last week, the price continued to rely on the daily resistance to be under pressure. At present, the daily resistance is at the 3355 area resistance, and the price continues to pay attention to the pressure before it is on the stand. According to the four-hour level, the key position of the four-hour position is the key to our emphasis on short-term trends. Yesterday's price fluctuates and rises based on the four-hour support. At present, as time goes by, we need to pay attention to today's morning low of 3342. This position is a key watershed in the short-term price trend. Once the price breaks down, we will pay attention to further pressure. From an hour's perspective, yesterday's strong closing, but after breaking through yesterday's high point today, it shows that gold is not a strong rise at present. On the contrary, it is necessary to pay attention to whether it can fall further. The key is that the morning session below will become a key watershed, and the price will further continue after breaking down. Conservatives watch more and less movement during the dayFollow the layout after non-agricultural data is released.
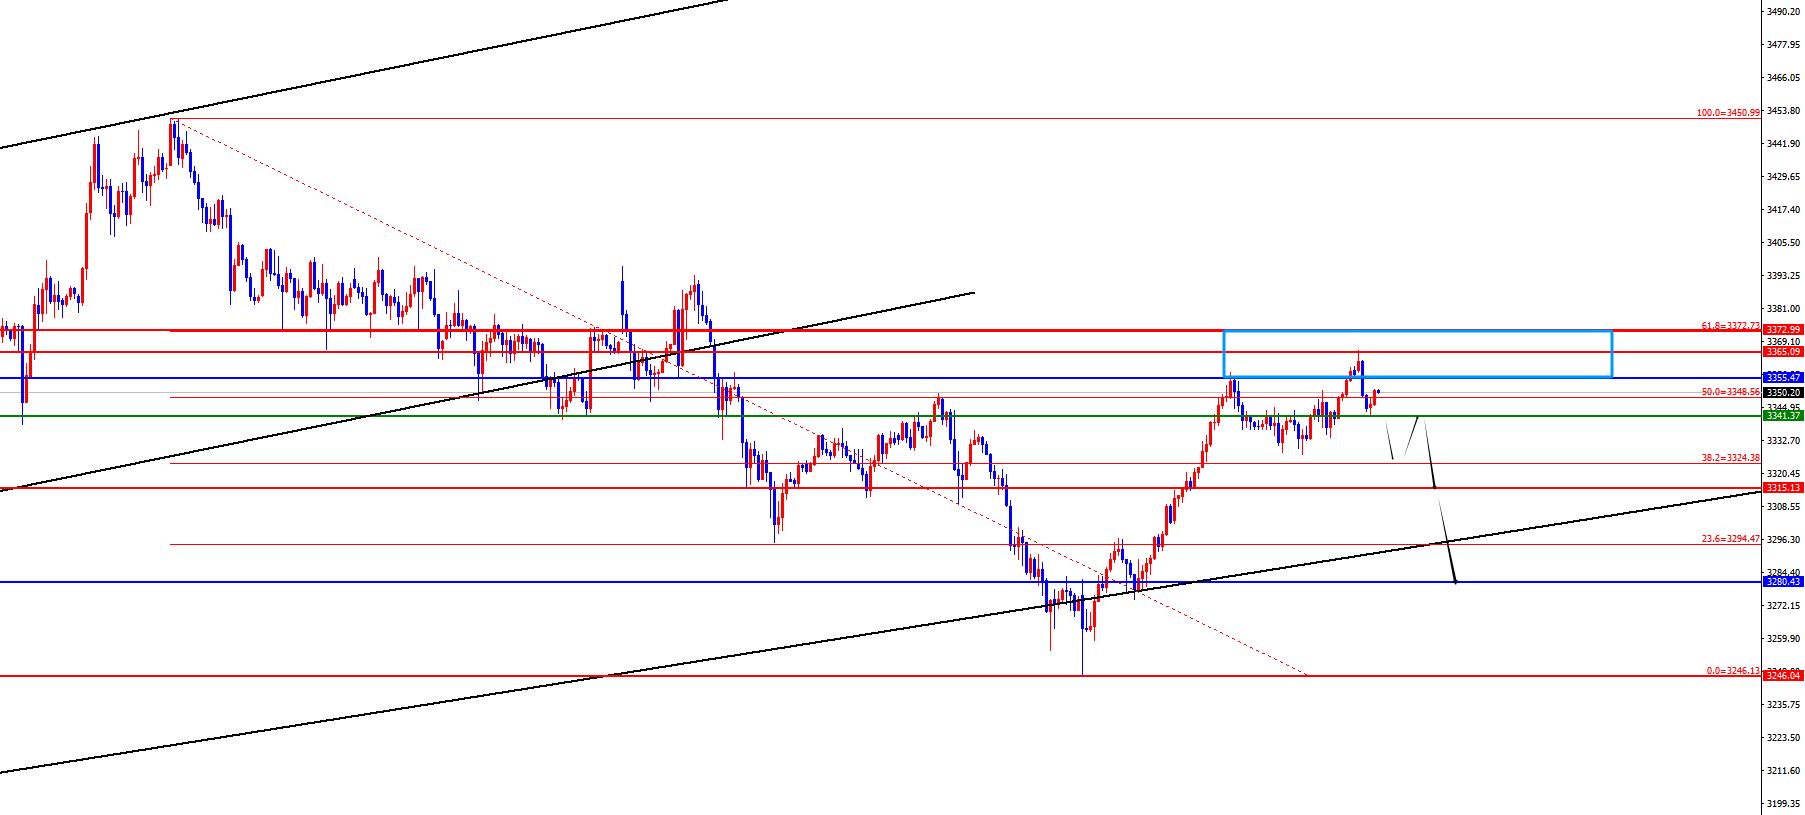
Gold is under pressure under strong resistance of 3365-75, and the price will continue after falling below the early trading low
European and the United States
European and the United States
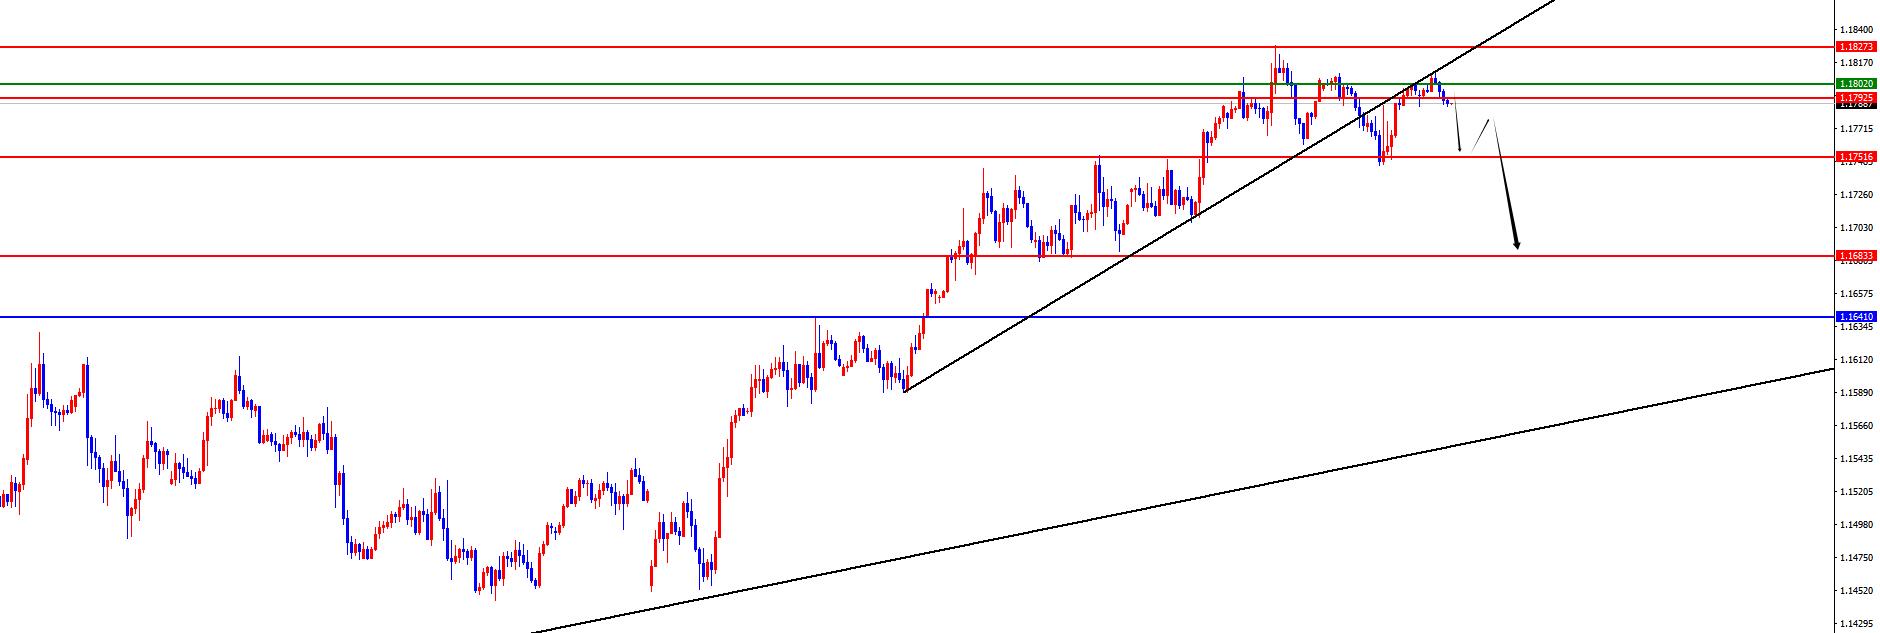
European and the United States, the prices in Europe and the United States were generally down on Wednesday. The price fell to 1.1746 on the day and rose to 1.1809 on the spot and closed at 1.1798 on the spot. Looking back at the performance of European and American markets on Wednesday, the price fluctuated in the short term and then was under pressure again during the early trading session. When the price fell below the key position, it did not continue, but instead rose again. In the end, although the negative line ended on the day, a long lead was left below. Although there are many in Europe and the United States at present, we need to continue to beware of pressure. The temporary high point this week is a watershed for whether it can rise. Before breaking the level, you will first look at the volatility and decline. Today, non-agricultural data will be welcomed, focusing on the guidance of the data.
From a multi-cycle analysis, from the perspective of the monthly line level, Europe and the United States are supported at 1.0850, so long-term bulls are treated, and the monthly line will close today, so focus on closing performance. From the weekly level, the price is supported by the 1.1380 area, and from the perspective of the mid-line, the price decline is temporarily treated as a correction in the mid-line rise. From the daily level, as time goes by, we need to focus on the 1.1640 regional watershed, and the temporary bands above this position are treated more frequently. From the four-hour level, we need to pay attention to the resistance in the 1.1790 area. This position is the key to the short-term trend. At present, short-term downward breaks are underway, so we need to pay attention to whether the pressure can be continued. The position is temporarily referred to the 1.1790-1.1800 range to look at the suppression, and the focus is on the 1.1750-1.1680 area below.
Europe and the United States have a short range of 1.1790-1.1800, defense is 40 points, target 1.1750-1.1680
[Finance data and events that are focused today] Thursday, July 3, 2025
①09:45 China's June Caixin Service Industry PMI
②14:30 Switzerland June CPI monthly rate
③15:00 Ministry of www.xmh100.commerce held a regular press conference
④15:50 France June The final value of the service industry PMI
⑤15:55 The final value of the service industry in Germany in June
⑥16:00 The final value of the service industry in the euro zone in June
⑦16:30 The final value of the service industry in the UK in June
⑧19:30 The ECB released the minutes of the June monetary policy meeting
⑨20:30 The unemployment rate in the United States in June
⑩20:30 The non-farm employment population in the United States in June
20:300 Number of people who requested initial unemployment benefits in the week from the United States to June 28
20:30 The average annual rate of hourly wages in the United States in June
20:30 The average monthly wages in the United States in June
20:30 The U.S. May trade account
21:45 The U.S. Global Services PMI final value
22:00 U.S. June ISM non-manufacturing PMI
22:00 U.S. Monthly rate of factory orders in May
22:30 EIA natural gas inventory in the week from the United States to June 27
23:00 Federal Reserve Bostic delivered a speech on monetary policy
The next day 01:00 US to July 4
Total number of oil drilling rigs in the week from the United States to July 4
Note: The above is only personal opinion and strategy, for reference and www.xmh100.communication only, and does not give customers any investment advice. It has nothing to do with customers' investment, and is not used as a basis for placing an order.
The above content is all about "[XM Forex Decision Analysis]: ADP records negative values, wait for the performance of non-agricultural data". It was carefully www.xmh100.compiled and edited by the XM Forex editor. I hope it will be helpful to your transactions! Thanks for the support!
Life in the present, don’t waste your current life in missing the past or looking forward to the future.
Disclaimers: XM Group only provides execution services and access permissions for online trading platforms, and allows individuals to view and/or use the website or the content provided on the website, but has no intention of making any changes or extensions, nor will it change or extend its services and access permissions. All access and usage permissions will be subject to the following terms and conditions: (i) Terms and conditions; (ii) Risk warning; And (iii) a complete disclaimer. Please note that all information provided on the website is for general informational purposes only. In addition, the content of all XM online trading platforms does not constitute, and cannot be used for any unauthorized financial market trading invitations and/or invitations. Financial market transactions pose significant risks to your investment capital.
All materials published on online trading platforms are only intended for educational/informational purposes and do not include or should be considered for financial, investment tax, or trading related consulting and advice, or transaction price records, or any financial product or non invitation related trading offers or invitations.
All content provided by XM and third-party suppliers on this website, including opinions, news, research, analysis, prices, other information, and third-party website links, remains unchanged and is provided as general market commentary rather than investment advice. All materials published on online trading platforms are only for educational/informational purposes and do not include or should be considered as applicable to financial, investment tax, or trading related advice and recommendations, or transaction price records, or any financial product or non invitation related financial offers or invitations. Please ensure that you have read and fully understood the information on XM's non independent investment research tips and risk warnings. For more details, please click here
CATEGORIES
News
- 【XM Group】--EUR/USD Forecast: Overhead Resistance
- 【XM Decision Analysis】--USD/CAD Forecast: Pulls Back Against Canadian Dollar
- 【XM Market Review】--USD/ZAR Analysis: Higher Range Sustained as Holiday Trading
- 【XM Market Analysis】--ETH/USD Forecast: Continues to See Upward Movement
- 【XM Market Analysis】--AUD/USD Forex Signal: Strong Drop to New 2-Year Low