


Trusted by over 15 Million Traders
The Most Awarded Broker
for a Reason
Easy Access to 1,400+ Global Assets
EURUSD
Euro vs U.S. Dollar
US500
S&P 500 (US500)
GOLD
Gold
COFFEE
US Coffee
Apple
Apple (AAPL.OQ)
-

Finance Magnates 颁发
-

Finance Magnates 颁发
-

Capital Finance International Magazine (CFI.co) 2024年颁赠
-

COLWMA 2024年颁赠
-

荣获World Finance Forex Awards 2023最佳外汇客户服务奖
-

荣获World Finance Forex Awards 2023欧洲最佳外汇经纪商奖
-

荣获World Finance Forex Awards 2023澳大拉西亚最佳外汇经纪商奖
-

荣获World Finance Forex Awards 2023拉丁美洲最佳外汇经纪商奖
-

荣获World Finance Forex Awards 2023中东最佳外汇经纪商奖
-

CFI.co于2023年颁赠
-

荣获2023年City of London Wealth Management Awards
-

荣获2022年埃及金融博览会颁赠
-

荣获2022年City of London Wealth Management Awards
-

CFI.co于2022年颁赠
-

荣获Global Forex Awards 2022 — 零售外汇 颁赠
-
2021年迪拜外汇博览会获颁赠
-

Ultimate Fintech 2021年颁赠
-

荣获2021年City of London Wealth Management Awards
-

FX168于2020年12月颁赠
-

荣获Global Business Awards 2020
-

荣获2020年City of London Wealth Management Awards
-

Capital Finance International Magazine (CFI.co)颁赠
-

Capital Finance International Magazine (CFI.co)颁赠
-

荣获2019年City of London Wealth Management Awards
-

Shares Magazine 授予 UK Forex Awards 2018
-

Capital Finance International Magazine (CFI.co)颁赠
-

Capital Finance International Magazine (CFI.co)颁赠
-

2017年伦敦财富管理奖
-

2016最佳本土 客户服务
-

中东和北非地区(MENA)增长最快的经纪商
-
2015年最佳外汇科技提供商
-
2014年最佳外汇科技提供商
-

2014年最佳外汇科技提供商
-

荣获 The Trading Show 2024年非洲 Africa Fintech 峰会颁赠
-

荣获2024年中东地区 Brokersview 颁赠
-
荣获2024年中东地区 Brokersview 颁赠
-

荣获2024年阿曼 Smart Vision 峰会颁赠
-

荣获2024年迪拜外汇博览会颁赠
-

荣获2024年迪拜 Forex Traders Summit 颁赠
-

2024年埃及 Smart Vision 峰会颁赠
-

投查查于2024年颁赠
-

Capital Finance International Magazine (CFI.co) 2024年颁赠
-

CFI.co于2023年颁赠
-

CFI.co于2023年颁赠
-

交易社区平台FOLLOWME于2022年颁赠
-
2022年迪拜Forex Expo获颁赠
-
2022年迪拜Forex Expo获颁赠
-

荣获Global Forex Awards 2022 — 零售外汇 颁赠
-

CFI.co于2022年颁赠
-

CFI.co于2022年颁赠
-

World Finance Forex Awards 2022 颁发
-

World Finance Forex Awards 2022 颁发
-

World Finance Forex Awards 2022 颁发
-

World Finance Forex Awards 2022 颁发
-
交易社区平台FOLLOWME于2021年颁赠
-

2021年埃及Smart Vision Investment Expo博览会获颁赠
-

CFI.co于2021年颁赠
-

CFI.co于2021年颁赠
-

荣获Global Forex Awards 2021 — 零售外汇 颁赠
-

荣获Global Forex Awards 2021 — 零售外汇 颁赠
-

World Finance 2021颁发
-

World Finance 2021颁发
-
FOLLOWME于2021年颁赠
-

Global Forex Awards 2021 — B2B 颁赠
-

Global Forex Awards颁赠
-

Global Forex Awards颁赠
-

CFI.co于2020年颁赠
-

CFI.co于2020年颁赠
-

荣获Global Business Awards 2020
-

World Finance Magazine 颁赠
World Finance Forex Awards 2020 -

World Finance Magazine 颁赠
World Finance Forex Awards 2020 -
FOLLOWME交易社区授予
-

Global Forex Awards颁赠
-

Global Forex Awards颁赠
-

FinTech Age Awards颁发
-

World Finance Magazine 颁赠
World Finance Forex Awards 2019 -

World Finance Magazine 颁赠
World Finance Forex Awards 2019 -

荣获 World Finance Forex Awards 2018 颁赠
-

荣获2018年埃及金融博览会颁赠
-

荣获 Shares Magazine 的 UK Forex Awards 2017 颁赠
-

荣获 World Finance Forex Awards 2017
-

2016年最佳黄金经纪商
-

2016年最佳外汇经纪商
-

2015年最佳本地客户服务
-

Global Brands Magazine 颁赠
-

Online Money Awards 2022 颁发
-

荣获2022年埃及金融博览会颁赠
-

2015最佳外汇交易平台
-

2015最佳金融交易平台
-

2013最佳创新外汇平台奖
-

2020年 Cyprus HR Awards 颁赠
-

金融行业的佼佼者
-

认证最优金牌级别
-

2014年首届亚军
-
Finance Magnates 颁发
-
Finance Magnates 颁发
-
Capital Finance International Magazine (CFI.co) 2024年颁赠
-
COLWMA 2024年颁赠
-
荣获World Finance Forex Awards 2023最佳外汇客户服务奖
-
荣获World Finance Forex Awards 2023欧洲最佳外汇经纪商奖
-
荣获World Finance Forex Awards 2023澳大拉西亚最佳外汇经纪商奖
-
荣获World Finance Forex Awards 2023拉丁美洲最佳外汇经纪商奖
-
荣获World Finance Forex Awards 2023中东最佳外汇经纪商奖
-
CFI.co于2023年颁赠
-
荣获2023年City of London Wealth Management Awards
-
荣获2022年埃及金融博览会颁赠
-
荣获2022年City of London Wealth Management Awards
-
CFI.co于2022年颁赠
-
荣获Global Forex Awards 2022 — 零售外汇 颁赠
-
2021年迪拜外汇博览会获颁赠
-
Ultimate Fintech 2021年颁赠
-
荣获2021年City of London Wealth Management Awards
-
FX168于2020年12月颁赠
-
荣获Global Business Awards 2020
-
荣获2020年City of London Wealth Management Awards
-
Capital Finance International Magazine (CFI.co)颁赠
-
Capital Finance International Magazine (CFI.co)颁赠
-
荣获2019年City of London Wealth Management Awards
-
Shares Magazine 授予 UK Forex Awards 2018
-
Capital Finance International Magazine (CFI.co)颁赠
-
Capital Finance International Magazine (CFI.co)颁赠
-
2017年伦敦财富管理奖
-
2016最佳本土 客户服务
-
中东和北非地区(MENA)增长最快的经纪商
-
2015年最佳外汇科技提供商
-
2014年最佳外汇科技提供商
-
2014年最佳外汇科技提供商
-
荣获 The Trading Show 2024年非洲 Africa Fintech 峰会颁赠
-
荣获2024年中东地区 Brokersview 颁赠
-
荣获2024年中东地区 Brokersview 颁赠
-
荣获2024年阿曼 Smart Vision 峰会颁赠
-
荣获2024年迪拜外汇博览会颁赠
-
荣获2024年迪拜 Forex Traders Summit 颁赠
-
2024年埃及 Smart Vision 峰会颁赠
-
投查查于2024年颁赠
-
Capital Finance International Magazine (CFI.co) 2024年颁赠
-
CFI.co于2023年颁赠
-
CFI.co于2023年颁赠
-
交易社区平台FOLLOWME于2022年颁赠
-
2022年迪拜Forex Expo获颁赠
-
2022年迪拜Forex Expo获颁赠
-
荣获Global Forex Awards 2022 — 零售外汇 颁赠
-
CFI.co于2022年颁赠
-
CFI.co于2022年颁赠
-
World Finance Forex Awards 2022 颁发
-
World Finance Forex Awards 2022 颁发
-
World Finance Forex Awards 2022 颁发
-
World Finance Forex Awards 2022 颁发
-
交易社区平台FOLLOWME于2021年颁赠
-
2021年埃及Smart Vision Investment Expo博览会获颁赠
-
CFI.co于2021年颁赠
-
CFI.co于2021年颁赠
-
荣获Global Forex Awards 2021 — 零售外汇 颁赠
-
荣获Global Forex Awards 2021 — 零售外汇 颁赠
-
World Finance 2021颁发
-
World Finance 2021颁发
-
FOLLOWME于2021年颁赠
-
Global Forex Awards 2021 — B2B 颁赠
-
Global Forex Awards颁赠
-
Global Forex Awards颁赠
-
CFI.co于2020年颁赠
-
CFI.co于2020年颁赠
-
荣获Global Business Awards 2020
-
World Finance Magazine 颁赠
World Finance Forex Awards 2020 -
World Finance Magazine 颁赠
World Finance Forex Awards 2020 -
FOLLOWME交易社区授予
-
Global Forex Awards颁赠
-
Global Forex Awards颁赠
-
FinTech Age Awards颁发
-
World Finance Magazine 颁赠
World Finance Forex Awards 2019 -
World Finance Magazine 颁赠
World Finance Forex Awards 2019 -
荣获 World Finance Forex Awards 2018 颁赠
-
荣获2018年埃及金融博览会颁赠
-
荣获 Shares Magazine 的 UK Forex Awards 2017 颁赠
-
荣获 World Finance Forex Awards 2017
-
2016年最佳黄金经纪商
-
2016年最佳外汇经纪商
-
2015年最佳本地客户服务
-
Global Brands Magazine 颁赠
-
Online Money Awards 2022 颁发
-
荣获2022年埃及金融博览会颁赠
-
2015最佳外汇交易平台
-
2015最佳金融交易平台
-
2013最佳创新外汇平台奖
-
2020年 Cyprus HR Awards 颁赠
-
金融行业的佼佼者
-
认证最优金牌级别
-
2014年首届亚军

Awarded BestBrokerYear After Year
CATEGORIES
News
- The Fed is about to make a speech, is the next jump of the euro/dollar to go up
- Keep going up! Is the range suitable for breaking?
- U.S. stocks hit new highs, tech stocks surge mask potential divisions
- Gold, more than 3385!
- Waiting for Powell Jackson Hall to speak, the United States and Europe finalize
market analysis
The gold daily line is under pressure and pulls back, waiting for the 3300 to stabilize again
Wonderful introduction:
Life needs a smile. When you meet friends and relatives, you can give them a smile, which can inspire people's hearts and enhance friendships. When you receive help from strangers, you will feel www.xmh100.comfortable with both parties; if you give yourself a smile, life will be better!
Hello everyone, today XM Foreign Exchange will bring you "[XM Foreign Exchange Official Website]: The daily line of gold is under pressure and pulls back, waiting for the 3300 to stabilize again." Hope it will be helpful to you! The original content is as follows:
Zheng's silver point: The gold daily line is under pressure and pulls back, waiting for the 3300 to stabilize again
Review yesterday's market trend and technical points:
First, in terms of gold: last Friday, it has been running around the 20-meter range of 3400-3380 for a day, but yesterday's opening was under pressure and could not stand up because the daily line closed at 5 Above the day, and the long lower shadow cross K, forming a right shoulder cross long www.xmh100.combination pattern with the positive line on the previous day. During the upward process, it is treated more as a continuous rise. Therefore, it pulls back early in the morning to above the upper track support point of the upward channel of the hourly line in the early stage, and continues to test bullishness, but the market chose to break down, and loses the overnight low on Friday, and fails to get out; this also means that the short-term trend has changed, from a strong upward line last week to a weaker one. Reduction, the afternoon plan rebound confirms that the upper rail pressure point of the channel is 3390 and the decline is not given, but it does not give a chance. It only suppresses the top and bottom resistance of 3380 directly, and the European session continues to fall slowly, and the US session reaches the 3350 line; the European session is weak, and the US session has a secondary pressure, but this slow decline is unable to rebound, which gives no expected rebound resistance level. When the hourly line shows the bottom long shadow of the downward positive K, the retracement confirms that 3350 follows a rebound and reaches 3 361 took the meter and waited for the 3370-80 resistance zone but still couldn't give you a chance;
Second, silver: silver's short-term trend is slightly stronger than gold, but it also closed a negative line on the daily line. The research report mentioned 37.6 support, and the intraday touched and rebounded a wave to 37.96, approaching the 38 mark;
Today's market analysis interpretation:
First, gold daily line level: closed one yesterdayFull and big negative, the closing falls below the old convergence triangle lower track support 3365, and slightly breaks the 10 moving average, so the continuous pull-up last week will temporarily end and enter a correction correction; today's rebound confirms the pressure of the old triangle lower track, which is also the 5 moving average position, about 3370-75. If it cannot be suppressed during the day, the short-term will continue to fluctuate and decline, but the space below is not expected to be large, and it is difficult to get below 3300; referring to the two trends after the stabilization of 3120 and 3247, it can be roughly predicted that after the stabilization of 3267, the extreme support confirmed by the decline is not too much. It will lose its 786 division position, which is 3298, just the derivative support point corresponding to the 3120-3267 trend connection line, and it is also approaching the 3300 mark. This will be the starting low point for the next oscillation and pull-up, and it is also the best reference point for the low-level market bottom again. After it stabilizes, it will at least rise above 3400 again to test the new convergence triangle upper track 3420-30; overall, it is still in the bull market bull trend and continue to consolidate and correct. In another 10 days, it will be a full four months. Please wait patiently for the bull market to continue to appear in the second half of the year!
Second, gold 4-hour level: the middle rail 3375 line will always have counter-pressure in this cycle, and the first time it touches is expected to fall under pressure; and the corresponding macd has been www.xmh100.completely repaired below the zero axis. The next two or three days will be the time to brew the bottom to stabilize, and wait for it to produce a volume divergence pattern;
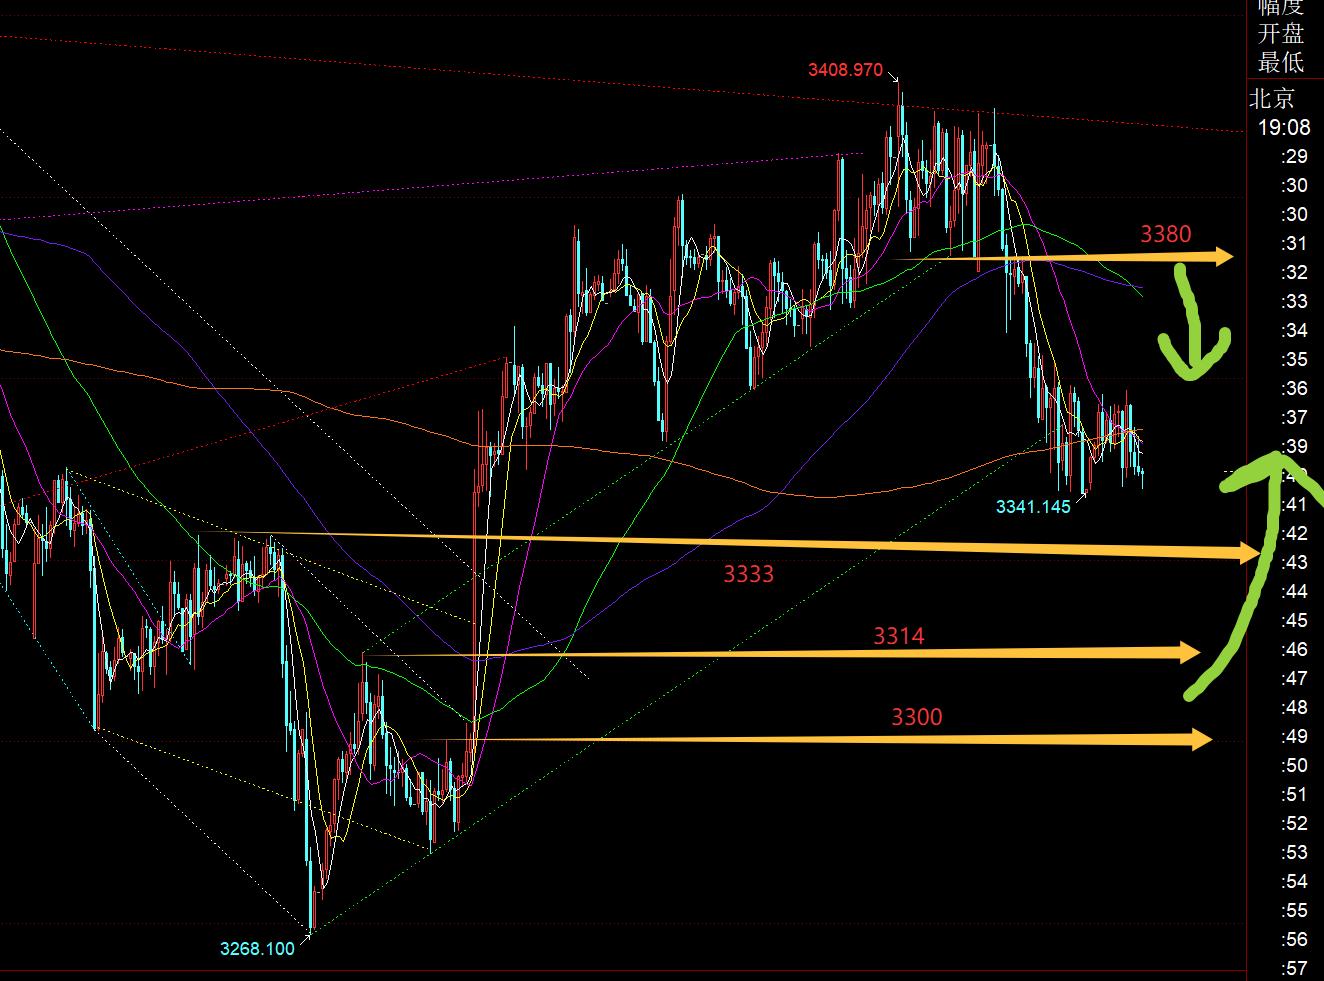
Third, the golden hourly line level: After a sharp drop, today, the 20 meters around 3340-3360 have been running back and forth for a long time, and the expected bearish resistance level is 3370-80, or the bullish support level is 3338-30. Next is the CPI data tonight. The market expects inflation to rise, and see if the announcement will be false. It is also the key to measuring interest rate cuts in September. From the trend, the day is still weak, and it tends to fall directly tonight, and then use the bottom divergence to bottom and pull up and move up to the bottom; or pull it quickly first, then move back and fall, it is also a fluctuation; as for whether it is sharp or pull it quickly first, it depends on the data; it is always oscillation, and there will be no small unilateral appearance, because this convergence triangle has been consolidated for nearly four months, and it will always www.xmh100.come out. The three current waves of movements have similarities. The time for suppression and downward correction generally takes three to four trading days, and a short-term turning point may be stabilized this Friday; if you first rise up to 3370-80 and see a pressure signal to look back and downward, if you fall first, pay attention to the top and bottom positions representing the non-agricultural wave of pulling up, 618 split position, 786 split position, etc.; each position stabilizes K, but you can look at a certain rebound space in the short term, and you can close when you see it is better. The lower the price pressure, the more you dare to test the rebound. Hold a relatively low position. Inadvertently, you will find that in a few days, it is another 100-meter pull-up, and you have already gone at least four or five times;
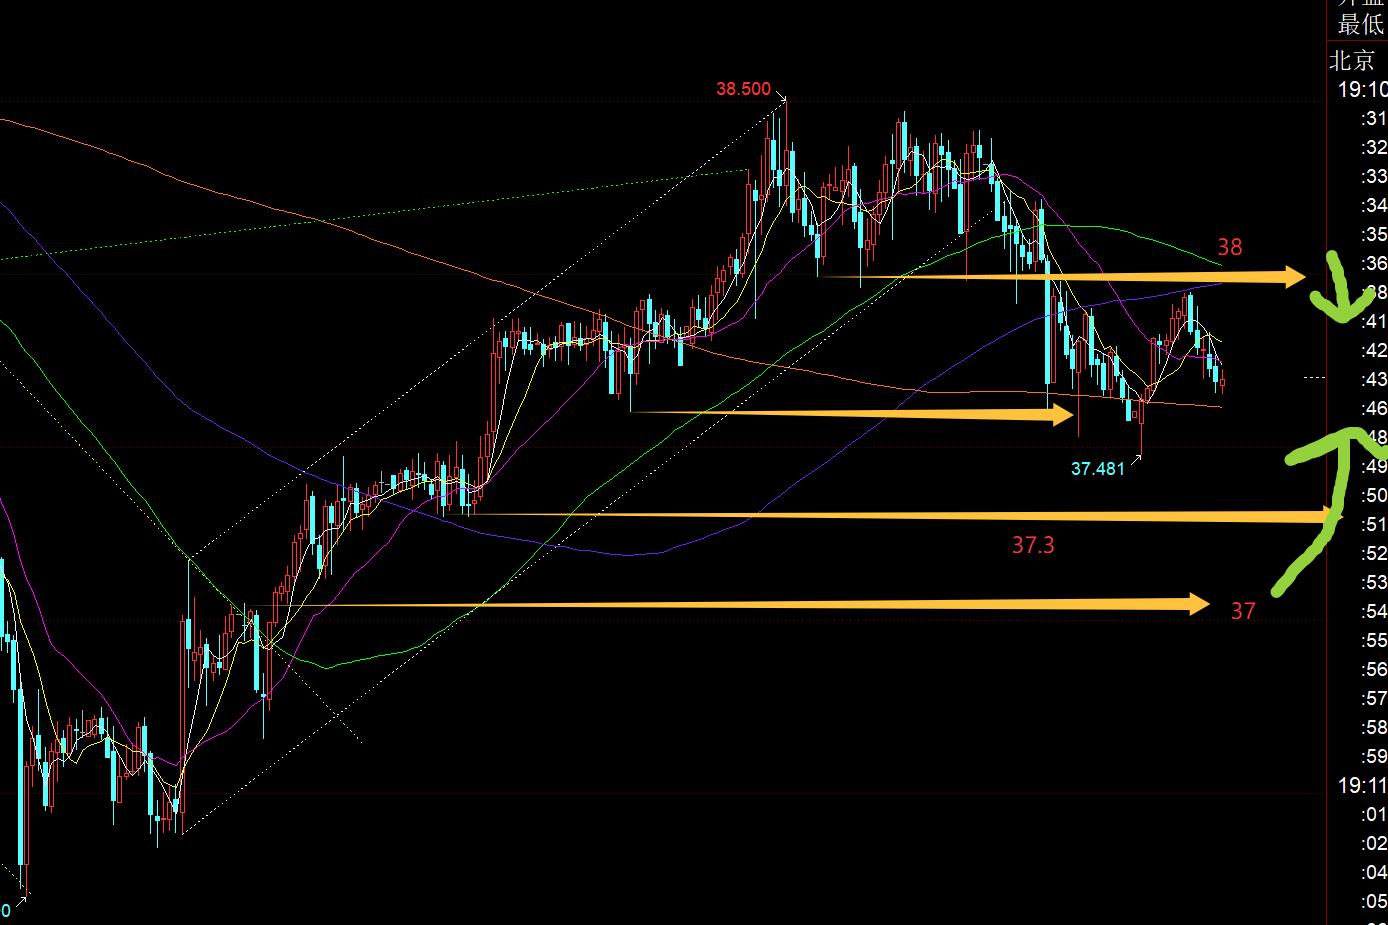
Silver: Silver has been rising for a long time last week, and it was also negatively suppressed and corrected this Monday. It will also fluctuate and consolidate in the next few days. Pay attention to several support points of 37.3 and 37 tonight. The daily level close to 37 is a good strong support, and it is expected that the limit is almost the same here; and the resistance is relatively clear that 38. Once it breaks through and stands firm, it will begin to gradually strengthen; therefore, there is support between 38-37 tonight, and there is also support at the top and bottom of 37.3. If it stabilizes, it can be bullish in the short term. If it fails to 38, you can see a decline;
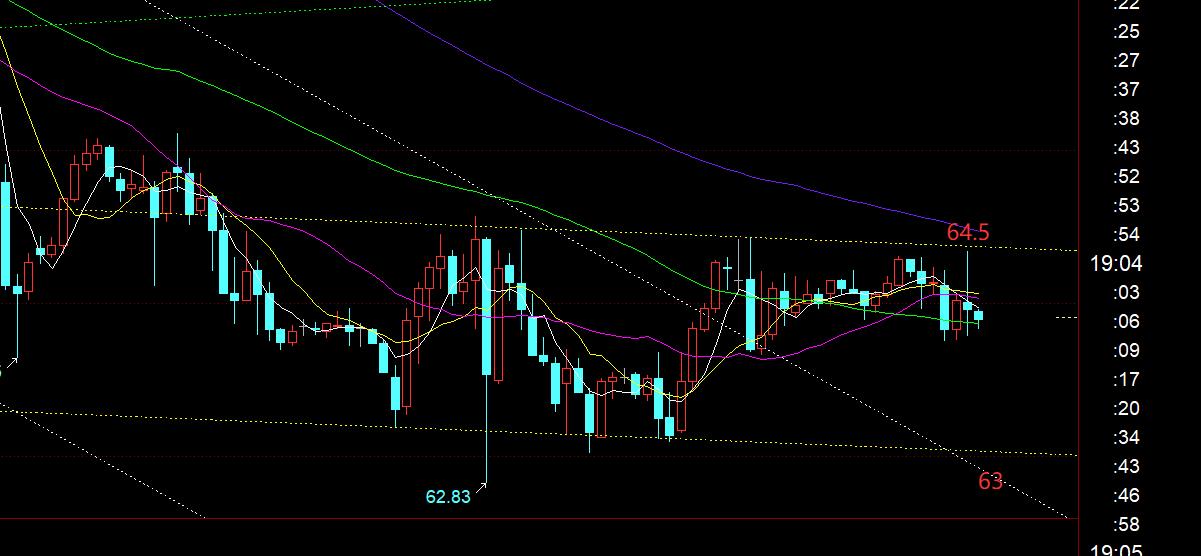
Crude oil: it is still weak in the short term, but the decline channel in the previous few days has been broken. In the past few days, you should be cautious about oversold rebounds and repair the macd divergence; tonight, pay attention to the resistance of 64.5, support 63, and try to rebound near 63, or break through and stand firm at 64.5, and then step back and confirm that you follow the rebound here; if an oversold rebound can occur, the primary pressure above is 66;
The above are several points of the author's technical analysis, For reference, it is also a summary of the technical experience accumulated over 12 hours of watching and reviewing the market for more than 12 hours a day. Technical points are disclosed every day, and friends who want to learn can www.xmh100.compare and refer to it based on the actual trend; those who recognize ideas can refer to operations, lead defense well, and risk control first; those who do not recognize them should just be over; thank everyone for their support and attention;
[The views of the article are for reference only, investment is risky, and you must be cautious, rational, and strict when entering the market. Setting losses, controlling positions, risk control first, and paying for profit and loss at your own risk]
Contributor: Zheng’s Dianyin
A study on the market for more than 12 hours a day, persisting for ten years, detailed technical interpretations are made public on the entire network, and serve the wholeheartedly, sincerely, perseveringly and wholeheartedly! www.xmh100.comments written on major financial websites! Proficient in K-line rules, channel rules, time rules, moving average rules, segmentation rules, and top-bottom rules; student cooperation registration hotline - WeChat: zdf2899 84986
The above content is all about "[XM Forex Official Website]: The golden daily line is under pressure and pullback, waiting for the 3300 to stabilize again". It was carefully www.xmh100.compiled and edited by the editor of XM Forex. I hope it will be helpful to your trading! Thanks for your support!
In fact, responsibility is not helpless, not boring, it is as gorgeous as a rainbow. It is this colorful responsibility that has created a better life today. I will work hard to organize the article.
Disclaimers: XM Group only provides execution services and access permissions for online trading platforms, and allows individuals to view and/or use the website or the content provided on the website, but has no intention of making any changes or extensions, nor will it change or extend its services and access permissions. All access and usage permissions will be subject to the following terms and conditions: (i) Terms and conditions; (ii) Risk warning; And (iii) a complete disclaimer. Please note that all information provided on the website is for general informational purposes only. In addition, the content of all XM online trading platforms does not constitute, and cannot be used for any unauthorized financial market trading invitations and/or invitations. Financial market transactions pose significant risks to your investment capital.
All materials published on online trading platforms are only intended for educational/informational purposes and do not include or should be considered for financial, investment tax, or trading related consulting and advice, or transaction price records, or any financial product or non invitation related trading offers or invitations.
All content provided by XM and third-party suppliers on this website, including opinions, news, research, analysis, prices, other information, and third-party website links, remains unchanged and is provided as general market commentary rather than investment advice. All materials published on online trading platforms are only for educational/informational purposes and do not include or should be considered as applicable to financial, investment tax, or trading related advice and recommendations, or transaction price records, or any financial product or non invitation related financial offers or invitations. Please ensure that you have read and fully understood the information on XM's non independent investment research tips and risk warnings. For more details, please click here