


Trusted by over 15 Million Traders
The Most Awarded Broker
for a Reason
Easy Access to 1,400+ Global Assets
EURUSD
Euro vs U.S. Dollar
US500
S&P 500 (US500)
GOLD
Gold
COFFEE
US Coffee
Apple
Apple (AAPL.OQ)
-

Finance Magnates 颁发
-

Finance Magnates 颁发
-

Capital Finance International Magazine (CFI.co) 2024年颁赠
-

COLWMA 2024年颁赠
-

荣获World Finance Forex Awards 2023最佳外汇客户服务奖
-

荣获World Finance Forex Awards 2023欧洲最佳外汇经纪商奖
-

荣获World Finance Forex Awards 2023澳大拉西亚最佳外汇经纪商奖
-

荣获World Finance Forex Awards 2023拉丁美洲最佳外汇经纪商奖
-

荣获World Finance Forex Awards 2023中东最佳外汇经纪商奖
-

CFI.co于2023年颁赠
-

荣获2023年City of London Wealth Management Awards
-

荣获2022年埃及金融博览会颁赠
-

荣获2022年City of London Wealth Management Awards
-

CFI.co于2022年颁赠
-

荣获Global Forex Awards 2022 — 零售外汇 颁赠
-
2021年迪拜外汇博览会获颁赠
-

Ultimate Fintech 2021年颁赠
-

荣获2021年City of London Wealth Management Awards
-

FX168于2020年12月颁赠
-

荣获Global Business Awards 2020
-

荣获2020年City of London Wealth Management Awards
-

Capital Finance International Magazine (CFI.co)颁赠
-

Capital Finance International Magazine (CFI.co)颁赠
-

荣获2019年City of London Wealth Management Awards
-

Shares Magazine 授予 UK Forex Awards 2018
-

Capital Finance International Magazine (CFI.co)颁赠
-

Capital Finance International Magazine (CFI.co)颁赠
-

2017年伦敦财富管理奖
-

2016最佳本土 客户服务
-

中东和北非地区(MENA)增长最快的经纪商
-
2015年最佳外汇科技提供商
-
2014年最佳外汇科技提供商
-

2014年最佳外汇科技提供商
-

荣获 The Trading Show 2024年非洲 Africa Fintech 峰会颁赠
-

荣获2024年中东地区 Brokersview 颁赠
-
荣获2024年中东地区 Brokersview 颁赠
-

荣获2024年阿曼 Smart Vision 峰会颁赠
-

荣获2024年迪拜外汇博览会颁赠
-

荣获2024年迪拜 Forex Traders Summit 颁赠
-

2024年埃及 Smart Vision 峰会颁赠
-

投查查于2024年颁赠
-

Capital Finance International Magazine (CFI.co) 2024年颁赠
-

CFI.co于2023年颁赠
-

CFI.co于2023年颁赠
-

交易社区平台FOLLOWME于2022年颁赠
-
2022年迪拜Forex Expo获颁赠
-
2022年迪拜Forex Expo获颁赠
-

荣获Global Forex Awards 2022 — 零售外汇 颁赠
-

CFI.co于2022年颁赠
-

CFI.co于2022年颁赠
-

World Finance Forex Awards 2022 颁发
-

World Finance Forex Awards 2022 颁发
-

World Finance Forex Awards 2022 颁发
-

World Finance Forex Awards 2022 颁发
-
交易社区平台FOLLOWME于2021年颁赠
-

2021年埃及Smart Vision Investment Expo博览会获颁赠
-

CFI.co于2021年颁赠
-

CFI.co于2021年颁赠
-

荣获Global Forex Awards 2021 — 零售外汇 颁赠
-

荣获Global Forex Awards 2021 — 零售外汇 颁赠
-

World Finance 2021颁发
-

World Finance 2021颁发
-
FOLLOWME于2021年颁赠
-

Global Forex Awards 2021 — B2B 颁赠
-

Global Forex Awards颁赠
-

Global Forex Awards颁赠
-

CFI.co于2020年颁赠
-

CFI.co于2020年颁赠
-

荣获Global Business Awards 2020
-

World Finance Magazine 颁赠
World Finance Forex Awards 2020 -

World Finance Magazine 颁赠
World Finance Forex Awards 2020 -
FOLLOWME交易社区授予
-

Global Forex Awards颁赠
-

Global Forex Awards颁赠
-

FinTech Age Awards颁发
-

World Finance Magazine 颁赠
World Finance Forex Awards 2019 -

World Finance Magazine 颁赠
World Finance Forex Awards 2019 -

荣获 World Finance Forex Awards 2018 颁赠
-

荣获2018年埃及金融博览会颁赠
-

荣获 Shares Magazine 的 UK Forex Awards 2017 颁赠
-

荣获 World Finance Forex Awards 2017
-

2016年最佳黄金经纪商
-

2016年最佳外汇经纪商
-

2015年最佳本地客户服务
-

Global Brands Magazine 颁赠
-

Online Money Awards 2022 颁发
-

荣获2022年埃及金融博览会颁赠
-

2015最佳外汇交易平台
-

2015最佳金融交易平台
-

2013最佳创新外汇平台奖
-

2020年 Cyprus HR Awards 颁赠
-

金融行业的佼佼者
-

认证最优金牌级别
-

2014年首届亚军
-
Finance Magnates 颁发
-
Finance Magnates 颁发
-
Capital Finance International Magazine (CFI.co) 2024年颁赠
-
COLWMA 2024年颁赠
-
荣获World Finance Forex Awards 2023最佳外汇客户服务奖
-
荣获World Finance Forex Awards 2023欧洲最佳外汇经纪商奖
-
荣获World Finance Forex Awards 2023澳大拉西亚最佳外汇经纪商奖
-
荣获World Finance Forex Awards 2023拉丁美洲最佳外汇经纪商奖
-
荣获World Finance Forex Awards 2023中东最佳外汇经纪商奖
-
CFI.co于2023年颁赠
-
荣获2023年City of London Wealth Management Awards
-
荣获2022年埃及金融博览会颁赠
-
荣获2022年City of London Wealth Management Awards
-
CFI.co于2022年颁赠
-
荣获Global Forex Awards 2022 — 零售外汇 颁赠
-
2021年迪拜外汇博览会获颁赠
-
Ultimate Fintech 2021年颁赠
-
荣获2021年City of London Wealth Management Awards
-
FX168于2020年12月颁赠
-
荣获Global Business Awards 2020
-
荣获2020年City of London Wealth Management Awards
-
Capital Finance International Magazine (CFI.co)颁赠
-
Capital Finance International Magazine (CFI.co)颁赠
-
荣获2019年City of London Wealth Management Awards
-
Shares Magazine 授予 UK Forex Awards 2018
-
Capital Finance International Magazine (CFI.co)颁赠
-
Capital Finance International Magazine (CFI.co)颁赠
-
2017年伦敦财富管理奖
-
2016最佳本土 客户服务
-
中东和北非地区(MENA)增长最快的经纪商
-
2015年最佳外汇科技提供商
-
2014年最佳外汇科技提供商
-
2014年最佳外汇科技提供商
-
荣获 The Trading Show 2024年非洲 Africa Fintech 峰会颁赠
-
荣获2024年中东地区 Brokersview 颁赠
-
荣获2024年中东地区 Brokersview 颁赠
-
荣获2024年阿曼 Smart Vision 峰会颁赠
-
荣获2024年迪拜外汇博览会颁赠
-
荣获2024年迪拜 Forex Traders Summit 颁赠
-
2024年埃及 Smart Vision 峰会颁赠
-
投查查于2024年颁赠
-
Capital Finance International Magazine (CFI.co) 2024年颁赠
-
CFI.co于2023年颁赠
-
CFI.co于2023年颁赠
-
交易社区平台FOLLOWME于2022年颁赠
-
2022年迪拜Forex Expo获颁赠
-
2022年迪拜Forex Expo获颁赠
-
荣获Global Forex Awards 2022 — 零售外汇 颁赠
-
CFI.co于2022年颁赠
-
CFI.co于2022年颁赠
-
World Finance Forex Awards 2022 颁发
-
World Finance Forex Awards 2022 颁发
-
World Finance Forex Awards 2022 颁发
-
World Finance Forex Awards 2022 颁发
-
交易社区平台FOLLOWME于2021年颁赠
-
2021年埃及Smart Vision Investment Expo博览会获颁赠
-
CFI.co于2021年颁赠
-
CFI.co于2021年颁赠
-
荣获Global Forex Awards 2021 — 零售外汇 颁赠
-
荣获Global Forex Awards 2021 — 零售外汇 颁赠
-
World Finance 2021颁发
-
World Finance 2021颁发
-
FOLLOWME于2021年颁赠
-
Global Forex Awards 2021 — B2B 颁赠
-
Global Forex Awards颁赠
-
Global Forex Awards颁赠
-
CFI.co于2020年颁赠
-
CFI.co于2020年颁赠
-
荣获Global Business Awards 2020
-
World Finance Magazine 颁赠
World Finance Forex Awards 2020 -
World Finance Magazine 颁赠
World Finance Forex Awards 2020 -
FOLLOWME交易社区授予
-
Global Forex Awards颁赠
-
Global Forex Awards颁赠
-
FinTech Age Awards颁发
-
World Finance Magazine 颁赠
World Finance Forex Awards 2019 -
World Finance Magazine 颁赠
World Finance Forex Awards 2019 -
荣获 World Finance Forex Awards 2018 颁赠
-
荣获2018年埃及金融博览会颁赠
-
荣获 Shares Magazine 的 UK Forex Awards 2017 颁赠
-
荣获 World Finance Forex Awards 2017
-
2016年最佳黄金经纪商
-
2016年最佳外汇经纪商
-
2015年最佳本地客户服务
-
Global Brands Magazine 颁赠
-
Online Money Awards 2022 颁发
-
荣获2022年埃及金融博览会颁赠
-
2015最佳外汇交易平台
-
2015最佳金融交易平台
-
2013最佳创新外汇平台奖
-
2020年 Cyprus HR Awards 颁赠
-
金融行业的佼佼者
-
认证最优金牌级别
-
2014年首届亚军

Awarded BestBrokerYear After Year
CATEGORIES
News
- UK PMI and inflation data push pound stronger than expected, while euro maintain
- 翻译错误:Unexpected character encountered while parsing value: <. Path '', line 0, p
- Chinese live lecture today's preview
- Gold is strengthening, buy at the bottom and go long today!
- In the key battle between the Euro 1.17, can the bulls take advantage of the vic
market analysis
High and fall back to the middle Yin line, gold and silver short and low after short
Wonderful Introduction:
A quiet path will always arouse a relaxed yearning in twists and turns; a huge wave, the thrilling sound can be even more stacked when the tide rises and falls; a story, only with regrets and sorrows can bring about a heart-wrenching desolation; a life, where the ups and downs show the stunning heroism.
Hello everyone, today XM Foreign Exchange will bring you "【XM Group】: High and fall back to the middle negative line, gold and silver short and low after low". Hope it will be helpful to you! The original content is as follows:
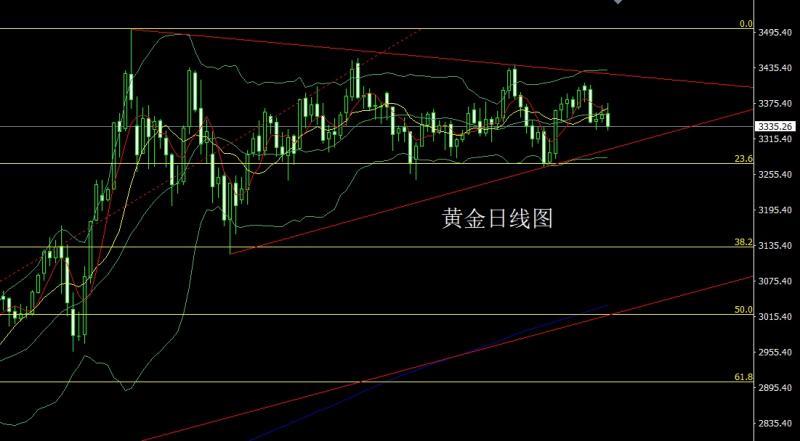
Yesterday, the gold market opened at the early trading position of 3357.6 and then the market rose first. The daily line reached the highest position of 3375.3 and then the market fluctuated strongly. The European market rose strongly during the European session, and the US market was subject to fundamental pressure. The daily line was at the lowest position of 3329.6 and then the market fluctuated at the low level. The daily line was the lowest. The daily line was the lowest. The daily line was the lowest. After the final closing line is at 3335.2, the daily line closes with a baroon line with a long upper shadow line. After this pattern ends, today's market is technically under pressure to fall. At the point, today's short-term 3350 is first to pull up 3350 and short-term 3352 is conservative 3356. The target below is 3335 and 3329. If it falls below, see 3321 and 3316 and 3308 and 3300-3292 to leave the market and prepare for band long positions to enter.
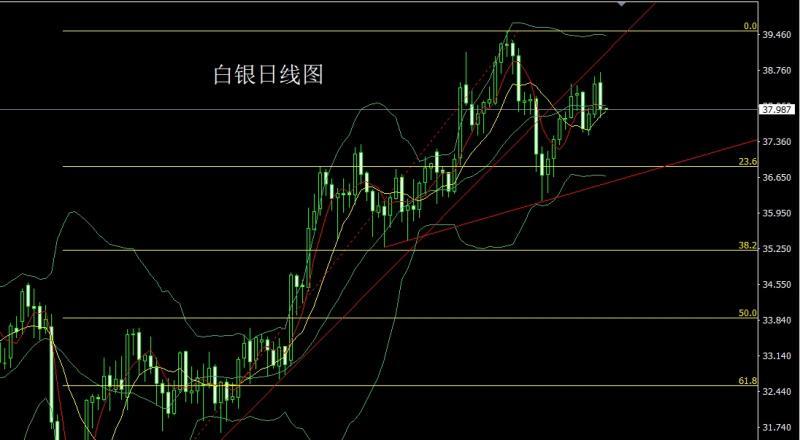
The silver market opened at 38.525 yesterday and the market first rose. The market fluctuated strongly. The daily line was at the lowest point of 37.823 and then the market consolidated. After the daily line finally closed at 38.008, the daily line closed with a large negative line with an upper and lower shadow line. After this pattern ended, the daily line was negatively wrapped around the positive. Today, the short stop loss of 38.35 today is 38 and 37.8, and the target below 37.6 and 37..45.
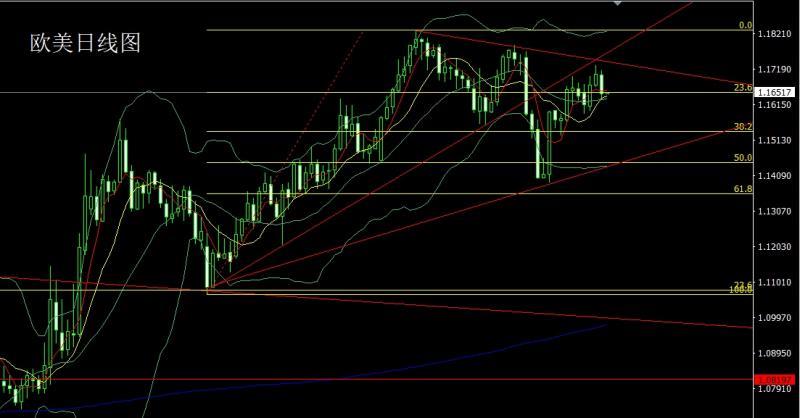
European and American markets opened at 1.17024 yesterday and the market first rose to the position of 1.17150. Then the market fluctuated strongly. The daily line was given the lowest position of 1.16302 and then the market consolidated. After the daily line finally closed at 1.16477, the daily line closed with a large negative line with a lower shadow line slightly longer than the upper shadow line. After this pattern ended, the daily line was negatively wrapped around the positive line. Today, the 1.16900 short stop loss was 1.017100. The target below looked at 1.16500 and 1.16300 fell below and see 1.16100 and 1.15900 support leaving the market.
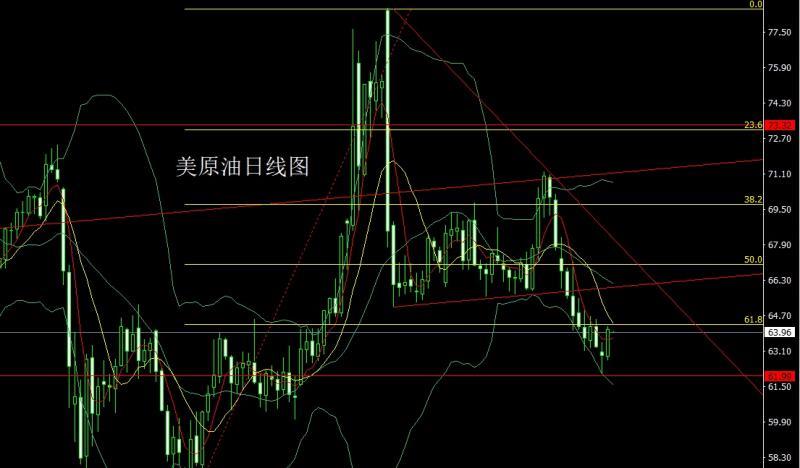
The US crude oil market opened at 62.88 yesterday and the market fell first. The daily line was at the lowest point of 62.67 and then the market fluctuated strongly. The daily line reached the highest point of 64.22 and then the market consolidated. After the daily line finally closed at 64.08, the daily line closed with a medium-positive line with a lower shadow line slightly longer than the upper shadow line. After this pattern ended, 63.3 was more stop loss 62.8 today, and the target was 64 and 64.5 and 65.
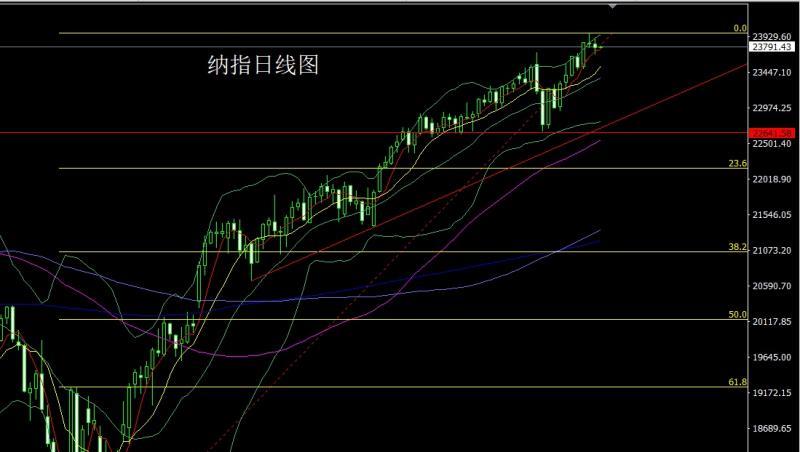
Nasdaq market opened at 23833.33 yesterday and the market rose first. The market fell rapidly during the start of the US market. The daily line reached the lowest position of 23692.89 and then the market rose strongly. The daily line reached the highest position of 23910.77 and then the market fell at the end of the trading session. The daily line finally closed at 23783.46 and then the market closed in a spindle pattern with an upper and lower shadow line. After this pattern ended, today, the target of 23860 short stop loss 23920 is 23700 and 23650 and 23600.
The fundamentals, yesterday's fundamentals, the US PPI increased by 0.9% month-on-month, the largest increase in three years. The market cuts the Federal Reserve's bet on interest rate cuts. In a speech by Fed officials, Daly said that a sharp cut of interest rates next month did not seem appropriate. Mousalem said the 50 basis point rate cut does not conform to the current economic situation or data. U.S. Treasury Secretary Bescent said he did not call on the Fed to cut interest rates by 150 basis points, but pointed out that the model showed neutral interest rates at lower levels. So this sharp turn speech and data www.xmh100.combined with the US index rose rapidly, with gold, silver and non-US markets falling. Today's fundamentals are still key to the US retail sales monthly rate in July at 20:30, the US New York Fed Manufacturing Index in August and the US import price index in July. This round is expected to be 0.5%. Then look at the monthly rate of industrial output in the United States in July at 21:15. Watch the beauty at 22:00 laterThe initial value of the expected one-year inflation rate in August and the monthly rate of www.xmh100.commercial inventory in the United States in June and the initial value of the University of Michigan Consumer Confidence Index in August. In addition, the US and Russian presidents will negotiate in the US at 3:30 tomorrow morning, and the results will affect the market's expected trend.
In terms of operation, gold: today, we will first lift 3350 shorts and conservative 3352 short stop loss 3356, look at 3335 and 3329, if we fall below, look at 3321 and 3316 and 3308 and 3300-3292 to leave the market and prepare for band long positions to enter the market.
Silver: Today's short stop loss of 38.35 38.55, the lower target is 38 and 37.8, and the lower target is 37.6 and 37.45.
Europe and the United States: Today's short stop loss of 1.16900 1.017100, the lower target is 1.16500 and 1.16300 1.16100 and 1.15900 support for exit.
U.S. crude oil: 62.8 today's 63.3 long stop loss 62.8, target 64 and 64.5 and 65.
Nasdaq: 23860 short stop loss 23920 today's 23700 and 23650 and 23600.
Yesterday's 3344-3346 long stop loss, 3353 left the market
The above content is about "【XM Group]: The content of "surges high and falls back to the middle negative line, gold and silver are short and short and low" is carefully www.xmh100.compiled and edited by the editor of XM Forex. I hope it will be helpful to your trading! Thanks for the support!
Life in the present, don’t waste your current life in missing the past or looking forward to the future.
Disclaimers: XM Group only provides execution services and access permissions for online trading platforms, and allows individuals to view and/or use the website or the content provided on the website, but has no intention of making any changes or extensions, nor will it change or extend its services and access permissions. All access and usage permissions will be subject to the following terms and conditions: (i) Terms and conditions; (ii) Risk warning; And (iii) a complete disclaimer. Please note that all information provided on the website is for general informational purposes only. In addition, the content of all XM online trading platforms does not constitute, and cannot be used for any unauthorized financial market trading invitations and/or invitations. Financial market transactions pose significant risks to your investment capital.
All materials published on online trading platforms are only intended for educational/informational purposes and do not include or should be considered for financial, investment tax, or trading related consulting and advice, or transaction price records, or any financial product or non invitation related trading offers or invitations.
All content provided by XM and third-party suppliers on this website, including opinions, news, research, analysis, prices, other information, and third-party website links, remains unchanged and is provided as general market commentary rather than investment advice. All materials published on online trading platforms are only for educational/informational purposes and do not include or should be considered as applicable to financial, investment tax, or trading related advice and recommendations, or transaction price records, or any financial product or non invitation related financial offers or invitations. Please ensure that you have read and fully understood the information on XM's non independent investment research tips and risk warnings. For more details, please click here